
Monitor your Agents in realtime
Joined August 2026
- Tweets43
- Following1
- Followers352
- Likes159







Introducing telemetry.dev, Datadog for your AI agents.
Live on Product Hunt today


Telemetry retweeted
Introducing the new telemetry.dev
LLM observability, now easy on the eyes. We redesigned every page: traces, sessions, logs, alerts, MCP analytics, and setup.
Light and dark, and it works on any device.
Introducing the new telemetry.dev
LLM observability, now easy on the eyes. We redesigned every page: traces, sessions, logs, alerts, MCP analytics, and setup.
Light and dark, and it works on any device.

Ask Claude Code why your agent failed.
telemetry.dev has a read-only MCP server. Claude Code, Cursor, or ChatGPT can read your traces, errors, and costs, and work out what went wrong.
In this run, it found a refund that was converted to cents twice.


When an agent gets stuck in a loop, telemetry.dev emails you.
Turn on the Agent loop alert and it checks your traces every 5 minutes. If one costs more than $2 or runs more than 30 spans, the email names the agent and the tool it kept calling, and Investigate opens that trace.
In the video, a support agent kept calling lookup_order after every call timed out. 41 spans in 29 seconds for under a cent, so the span limit caught it, and the email came 10 minutes after the run ended. A trace over the cost limit alerts one check sooner.
Alerts docs: telemetry.dev/docs/platform/…

See what each Claude Code prompt costs on telemetry.dev.
With Claude Code's tracing beta on, each prompt arrives as a trace with every model request and tool call. This one fixed two failing tests for $0.13 at API prices.
Setup guide: telemetry.dev/docs/integrati…
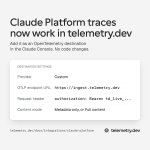
It's live. Add telemetry.dev as an OpenTelemetry destination in the Claude Console, no code changes.
Setup guide: telemetry.dev/docs/integrati…


Claude traces are coming to telemetry.dev, from the SDKs, the Messages API and Managed Agents.
You'll see tokens, cost and latency for every Claude call, counted once. Setup guide soon.
Telemetry retweeted

The @telemetrydev team chose Blume for their first docs!
useblume.dev/customers/telem…

Claude traces are coming to telemetry.dev, from the SDKs, the Messages API and Managed Agents.
You'll see tokens, cost and latency for every Claude call, counted once. Setup guide soon.

When an agent run goes wrong, open its trace on telemetry.dev.
Every model call and tool step is there, in order, with how long each took. The failed step is red, and you can read what went in and what came out.
Connect with our TypeScript or Python SDK, or point any OpenTelemetry exporter at it.

Telemetry retweeted

i have an extra free pro month of @telemetrydev left since the two went really fast
for the last one, i’m giving it directly to anyone who’s willing to try it and give us feedback on what’s missing or what they like a lot about telemetry.dev
New in telemetry.dev: token usage split by text, image and audio.
You see the split on the dashboard, on every trace and on every span. Cost uses each model's separate text, image and audio prices where the provider publishes them.

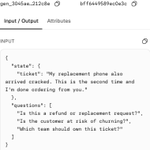
Building with Jev from TypeSafe @typesafeai? Its evaluate() calls through the AI SDK are traced like any other model call: the input state, the questions Jev answered, its answers, tokens and cost.

