

Using Technical Analysis to predict the market! These charts are use to Journal only.
Joined August 2020
- Tweets1.7K
- Following219
- Followers337
- Likes76


Pinned Tweet
What is stated in my charts/tweets:
-The pattern in the ticket
-Targets zones (Targets zone are resistance/supports)
-Time Frame (if lower than 1 day candles)
- Bounce level (if shown, this is where pattern will be invalid if it closes below it)
-Earlier tweet(for you to verify)
Captain Bull retweeted

After 10s of books read, 100s of hours of webinars/seminars watched, and 1,000s of trading hours since 2006, for me, it came down to these 5 books.
If u are curious about my process + what I share & want to learn more, there is no better place to start than the books below.
👇🏼👇🏼

$AAPL
Pattern - Box
Breakout- above resistance or support
Targets - shown for bullish
Note: broke out as it broke the resistance. Might see a pull back to 200ish but depends on the strength of the breakout.


$TSLA -
Pattern - Downward Channel
Targets are shown if Channel is broken
We are near the point whether TSLA has to decide whether it will move back up in the Channel or Break Down.


$TSLA update-
Channel has been broken on the top side after the triangle being broken as shown.
(Should see a small pullback to trendline)


$Amzn update
If we look at targets for asc triangle 2 which was formed in past few months, target 1 is in middle of our target 2 of Inv H&S!! We broke out of the traingle today!

$AMZN update: the H&S target 2 bottom was almost touched before pullback.
The ascending triangle broke out last week, but seeing H&S took a few months to develop, that bottom of target 2 is acting as resistance.


$NVDA -
Pattern: Bull Flag
Breakout: above the flag
Targets: Shown
Note: bouncing from support zone today (pic 2). It had broke out last Friday. SL approximately below 760.


$MBLY -
Support and resistance zones
Has hit support today. Let’s see if it moves up back to the resistance. We are forming a hammer candle.


$NVDA update:
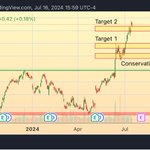
Near Target 2.
I have put a % trailing SL, don’t wanna lose the profits

$CCJ
Pattern- Head & Shoulders (Bullish)
Breakout - above the resistance zone
Targets - shown
(NOTE: Could be C&H but would get the same breakout point and targets)


$AMD after hitting all bullish targets, bearish targets 1&2 have been hit. Let's see if we will hit the aggressive target.
