

Product Manager at MongoDB.
Sydney
Joined December 2008
- Tweets402
- Following83
- Followers300
- Likes65



Tom Hollander retweeted

I’m getting more and more use out of @MongoDB charts. It’s awesome to simply visualize company metrics via existing data without any coding effort.

Tom Hollander retweeted

You asked, 🗣️ we listened.
Introducing the ability to export and import your MongoDB Charts dashboards ❗
Easily recreate your favorite charts/dashboards when moving from development to production environments or switching data sources.
↓
https://teapawt.net/t.co/fVA0oovHfV
Tom Hollander retweeted
🎉MongoDB Charts now has conditional formatting!
We're excited to announce the release of this feature, which has been the #1 request in user feedback.
See how conditional formatting will make finding insights faster and easier ➡️ https://teapawt.net/t.co/3vKxQJoF4u

#MongoDBCharts makes it ridiculously easy to embed data visualisations into your web apps, but sometimes developers want more than a static chart. Our latest update allows you to add interactivity to embedded charts by responding to click events. See mongodb.com/blog/post/add-in…
This month we've pushed out some great improvements to #MongoDBCharts, with a bunch of new customisation features to help get that perfect visualisation. mongodb.com/blog/post/new-wa…
#MongoDBCharts now lets you build a chart from multiple collections, using the power of Lookup fields. Find out how at mongodb.com/blog/post/new-lo…. #MongoDB #DataViz

Did you know you could build animated charts with #MonogDBCharts? I didn't either, but @MongoDB engineer Kristina Stefanova shows us how to use the embedding SDK to bring your charts to life! developer.mongodb.com/how-to…
Tom Hollander retweeted
MongoDB 4.4 is now GA with new features including:
- Custom aggregation expressions
- Union
- New aggregation operators & expressions
- Connection monitoring and pooling
- Global read & write concerns
- MongoDB Rust & Swift Drivers
Read more here: https://teapawt.net/t.co/8zLZhbvFsc
MongoDB Charts now comes with a sample dashboard and movies dataset, making it easier than ever to get started and learn data some new data visualisation skills. mongodb.com/blog/post/learni… #MongoDBCharts #MongoDB
1
Tom Hollander retweeted

Introducing the new #MongoDB Shell mongodb.com/blog/post/introd… Congrats @mmarcon and the team! Happy to see our vision becoming a reality!

It's been a year since we launched #MongoDB Charts, and we've been busy making it even better! Find out about all the latest features in this session @_scottsidwell and I delivered at #MDBlive 2020. youtube.com/watch?v=ZlDEl3VC… #MongoDBCharts #dataviz
2
Tom Hollander retweeted

Another announcement from @MongoDB on the #analytics front: MongoDB Charts upgrades include an embedding SDK, cached performance, and filtering features. MyPOV: Embedded analytics use cases are only growing. Put insight at the point of decisions.

ALT @MongoDB Charts #MDBLive
For any @MongoDB developers looking for an easier way to get data visualisations in their web apps - look no further! The #MongoDBCharts Embedding SDK is here! mongodb.com/blog/post/charts…
2
Tom Hollander retweeted

Welcome to the New MongoDB Cloud Navigation : ift.tt/3513Wrf Take a look at the redesigned MongoDB Cloud navigation for Atlas, Stitch, and Charts and how it helps users find what they need quickly and easily.
Tom Hollander retweeted

Dear @MongoDB,
I am loving it, these #MongoDB #Charts Visualisations of the Real-Time #Mongo #Database 😍😍
#JavaScript #100DaysOfCode #DataVisualization

ALT Visualizing Data with MongoDB Charts
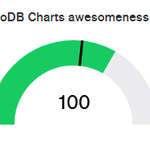
MongoDB Charts now has a gauge chart type. Track the awesomeness of your things at mongodb.com/charts #MongoDB #MongoDBCharts

2
The good news keeps coming for #MongoDBCharts users. Web developers have a new and powerful way to embed charts. The SDK is in beta so please try it out and give us feedback to help ensure the final release is as good as possible.

MongoDB Charts on Atlas embedding just got better!
You can now programmatically create and interact with charts in your own application using a Javascript SDK. Read the blog to learn more: mongodb.social/39rvAyP

The number 1 requested feature for #MongoDBCharts is now here - try it today for free on MongoDB Atlas!
MongoDB Charts on Atlas now supports dashboard-level filters so you can quickly change the context of a single dashboard to better focus your analysis. Read the blog to learn more: mongodb.social/2UPwcdt
