




Pinned Tweet
🔥 GET READY — TRADEFLOW NEW YEAR SPECIAL IS COMING!🔥
Something BIG is about to drop for the TradeFlow community.
#PLATINUM — Trade Smarter
👑 #ELITE — Our Most Popular Plan
💎 #BILLIONAIRE LOUNGE — Exclusively for VVIPs
🎁 Special New Year Pricing
🎁 +1 MONTH FREE
🎁 Limited Slots Only
This won’t stay open for long.
GET READY TO BOOK YOUR SLOT BEFORE IT RUNS OUT.
⏳ COMING SOON…
🌐 tradeflowsignals.com
📲 +92 331 2020902 | +92 339 2020902
#TradeFlow #NewYearSpecial #PSX #KSE100 #PakistanStockExchange
🤖 Made with AI

🚀 #ASTM HITS UPPER CAP @ 67.07 | +6.46% FROM LOW
TRADEFLOW ADVISORS | FREEMIUM
📅 Call Initiated: Thursday, 12-Nov-2026
Our Call: 60.97
Buying Range: 54.60–61.00
Low Tested: 63.00
Today’s High: 67.07 (Upper Cap)
Gain from Tested Low: +6.46%
Gain from Our Call: +10.01%
✅ TP1: 63.00–66.50 — ACHIEVED & SURPASSED
🎯 TP2: 68.50–69.60 — NEXT
ASTM hits its upper cap at 67.07, surpassing our first target zone on the same day as our Freemium recovery call. Momentum has strengthened, with TP2 now in focus.
Identified before the move. Delivered by the market.
TradeFlow Advisors — Timing Matters!
tradeflowsignals.com
#PSX #KSE100


#ASTM is attempting recovery after a sharp correction. Holding 58.30–60.15 would support the setup, while clearing 66.44, followed by 71.53, would strengthen the case for higher targets.
A recovery setup—not a confirmed broader reversal. Avoid chasing sharp rallies.
Freemium educational view only. Subject to market trend; targets are conditional. Strictly manage risk.
#PSX #KSE100

563
#ASTM is attempting recovery after a sharp correction. Holding 58.30–60.15 would support the setup, while clearing 66.44, followed by 71.53, would strengthen the case for higher targets.
A recovery setup—not a confirmed broader reversal. Avoid chasing sharp rallies.
Freemium educational view only. Subject to market trend; targets are conditional. Strictly manage risk.
#PSX #KSE100
586
#ASTM is attempting recovery after a sharp correction. Holding 58.30–60.15 would support the setup, while clearing 66.44, followed by 71.53, would strengthen the case for higher targets.
A recovery setup—not a confirmed broader reversal. Avoid chasing sharp rallies.
Freemium educational view only. Subject to market trend; targets are conditional. Strictly manage risk.
#PSX #KSE100
Pakistan T-Bill Auction | November 11, 2026
T-Bill cut-off yields declined by 22–48bps across all tenors, with the sharpest compression in the 12-month paper (−48bps), followed by 6-month (−46bps) and 3-month (−43bps).
The government raised Rs551bn against a target of Rs400bn, while total participation reached Rs1.59trn, reflecting strong demand for government securities.
TradeFlow Advisors | Market Intelligence
tradeflowsignals.com

589
#KSE100 | NOVEMBER & DECEMBER — HISTORICAL SEASONALITY
TRADEFLOW ADVISORS | MARKET INTELLIGENCE
Historical data suggests that November and December have generally been favourable months for the KSE-100 Index, although returns have varied considerably across different market cycles.
#November Performance
2021: −1.58%
2022: +2.63%
2023: +16.59%
2024: +13.93%
2025: +3.12%
2026: +7.62% (MTD, November 11)
Average Return (2021–2025): +6.94%
Positive Years: 4 out of 5 (80%)
#December Performance
2021: −1.20%
2022: −4.55%
2023: +3.17%
2024: +13.59%
2025: +4.43%
Average Return: +3.09%
Positive Years: 3 out of 5 (60%)
November has historically shown #stronger performance than December, particularly during the 2023–2024 market rally. However, these two years account for a significant portion of the average returns, suggesting that historical performance has been influenced by broader market conditions rather than seasonality alone.
With November 2026 already recording a 7.62% gain as of November 11, the index has maintained its historically positive November tendency so far.
The sustainability of the year-end rally will largely depend on market liquidity, interest rate expectations, corporate earnings and investor participation.
Historical seasonality offers useful perspective, but past returns are not necessarily indicative of future performance.
TRADEFLOW ADVISORS
tradeflowsignals.com

7
917
🚀 #PAEL HITS 35.61 | +13.05% FROM TESTED LOW!
TRADEFLOW ADVISORS | ELITE MEMBERS 👑
📅 Call Initiated: Friday, 16-Oct-2026
Our Call: 33.73
Buy Range: 32.70–34.20
Low Tested: 31.50
Today’s High: 35.61
Gain from Tested Low: +13.05%
Gain from Original Call: +5.57%
PAEL has staged a strong recovery from 31.50, testing 35.61 following our falling-wedge reversal idea. The stock has successfully cleared the highlighted 34.20–34.50 breakout zone, strengthening its short-term recovery outlook.
Identified before the breakout. Delivered by the market.
TradeFlow Advisors — Timing Matters!
tradeflowsignals.com

4
868
🚀 #SPEL HITS UPPER CAP @ 48.11 | +26.61% FROM LOW!
TRADEFLOW ADVISORS | BILLIONAIRES LOUNGE 👑
📅 Call Initiated: 26-Oct-2026
📅 Today: 11-Nov-2026
Our Call: 40.27
Low Tested: 38.00
Today’s High: 48.11 (Upper Cap)
Gain from Low: +26.61%
Gain from Call: +19.47%
✅ TP1: 42.81–45.79 — ACHIEVED & SURPASSED
🎯 TP2: 48.21–50.62 — NEXT
SPEL hits its upper cap at 48.11, delivering a sharp 26.61% recovery from its tested low of 38.00. Another high-risk quick trade idea successfully delivers, with TP1 surpassed and TP2 just around the corner.
Identified before the rally. Delivered by the market.
TradeFlow Advisors — Timing Matters!
tradeflowsignals.com

680
🚀 #MACFL HITS UPPER CAP AT 55.14 — +7.28% FROM CALL PRICE | TP1 SURPASSED
TRADEFLOW ADVISORS | FREEMIUM IDEA
Our short-term recovery call initiated on Wednesday, 11-Nov-2026, at 51.40 has delivered an impressive same-day rally, with MACFL hitting its upper circuit at 55.14.
Call Initiated Price: 51.40
Upper Cap Hit: 55.14
Gain from Call Price: +7.28% (51.40 → 55.14)
✅ TP1: 52.00–53.66 — ACHIEVED & SURPASSED
🎯 TP2: 55.31–57.66 — NEXT
One trading session. One upper cap. Another TradeFlow freemium call delivering results
TradeFlow Advisors — Timing Matters!
tradeflowsignals.com
whatsapp.com/channel/0029VaC…
#PSX #KSE100

#MACFL — SHORT-TERM RECOVERY WATCH
MACPAC Films Limited
Chart Price: 51.40 | Risk: High
#MACFL is attempting to build a base after its sharp correction. Holding 49.96 and sustaining above 52.00–53.66 would strengthen the short-term recovery towards higher Fibonacci resistance levels.
Buying range is chart-derived. This remains a short term rebound—not a confirmed broader reversal. Subject to market trend; strictly manage risk.
#PSX #KSE100

7
895
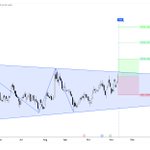
#PSO — SYMMETRICAL TRIANGLE | BULLISH BREAKOUT WATCH
CMP: 369.30 (+2.21%)
PSO is approaching a critical breakout zone around 370–375, following several months of consolidation within a symmetrical triangle.
The recent recovery from lower support indicates improving bullish momentum, with a sustained breakout potentially opening the way toward higher targets.
#PSX #KSE100

#MACFL — SHORT-TERM RECOVERY WATCH
MACPAC Films Limited
Chart Price: 51.40 | Risk: High
#MACFL is attempting to build a base after its sharp correction. Holding 49.96 and sustaining above 52.00–53.66 would strengthen the short-term recovery towards higher Fibonacci resistance levels.
Buying range is chart-derived. This remains a short term rebound—not a confirmed broader reversal. Subject to market trend; strictly manage risk.
#PSX #KSE100
SPSL 🚀🚀🚀
#SPSL — RECOVERY & BREAKOUT WATCH
Sitara Petroleum Service Limited
Chart Price: 13.12 | Risk: High
#SPSL is attempting a recovery from 11.43–11.50 support, reclaiming the 12.91–12.99 Fibonacci zone. Immediate resistance stands at 13.36, while the descending trendline near 14.00 remains a key hurdle. A sustained breakout would strengthen the recovery setup.
Buying range is chart-derived. The broader downtrend remains intact until confirmed otherwise. Subject to market trend; strictly manage risk.
#PSX #KSE100

5
828
🚀 #PSO HITS 373 — UP 4.19% FROM 358 | RESISTANCE TARGET REACHED
TRADEFLOW ADVISORS | BILLIONAIRES LOUNGE 👑
Wednesday, 11-Nov-2026, PSO tested 373, representing a 4.19% price appreciation from the tested low of 358.
✅ Resistance Target: 370–374 — REACHED
🎯 Breakout Above 374 — Next Confirmation
Our technical outlook has played out, with PSO reaching the projected resistance zone. A sustained breakout above 374 would strengthen the bullish structure.
The levels were identified before the move. Want the next setup before the breakout? Join TradeFlow Advisors!
TradeFlow Advisors — Timing Matters!
tradeflowsignals.com
#PSX #KSE100

6
956
#SPSL — RECOVERY & BREAKOUT WATCH
Sitara Petroleum Service Limited
Chart Price: 13.12 | Risk: High
#SPSL is attempting a recovery from 11.43–11.50 support, reclaiming the 12.91–12.99 Fibonacci zone. Immediate resistance stands at 13.36, while the descending trendline near 14.00 remains a key hurdle. A sustained breakout would strengthen the recovery setup.
Buying range is chart-derived. The broader downtrend remains intact until confirmed otherwise. Subject to market trend; strictly manage risk.
#PSX #KSE100
🚀 #DGKC HITS 215.31 — UP 20.96% FROM TESTED LOW | ST TARGET ACHIEVED
TRADEFLOW ADVISORS | ELITE MEMBERS
Back on Wednesday, 21-Oct-2026, we highlighted DGKC as a high-risk reversal opportunity at 179.63, with a buying range of 176.10–178.30 and a short-term target of 207.80.
Today, Tuesday, 10-Nov-2026, DGKC tested 215.31, gaining 20.96% from its actual tested low of 178.00 and 19.86% from our original reference price of 179.63.
✅ ST Target: 207.80 — ACHIEVED & SURPASSED
Our anticipated reversal has materialized, with DGKC advancing beyond its projected short-term target.
The levels were identified before the rally. Want the next opportunity before the move? Join TradeFlow Advisors!
TradeFlow Advisors — Timing Matters
tradeflowsignals.com

4
797
🚀 #GAL HITS 582.10 — UP 24.17% FROM TESTED LOW | TP1 & TP2 ACHIEVED
TRADEFLOW ADVISORS | BILLIONAIRES LOUNGE 👑
📅 Original Call: 15-Oct-2026 | Reshared: 22-Oct-2026
Our Call: 484.00
Accumulation Range: 460–490
Low Tested: 468.80
High Tested: 582.10
Gain from Tested Low: +24.17% (468.80 → 582.10)
Gain from Original Call: +20.27% (484.00 → 582.10)
✅ TP1: 513–535 — ACHIEVED & SURPASSED
✅ TP2: 554–577 — ACHIEVED & SURPASSED
GAL has extended its bullish recovery, testing 582.10, comfortably surpassing both target zones identified in our positional accumulation setup.
From the tested low of 468.80, the stock has appreciated 24.17%, validating our earlier bullish outlook.
The levels were identified before the rally. Want the next setup before the breakout? Join TradeFlow Advisors!
TradeFlow Advisors — Timing Matters
tradeflowsignals.com

2
664
🚀 #GHNI HITS 1,252 — UP 11.39% | ST TARGET ACHIEVED
TRADEFLOW ADVISORS | BILLIONAIRES LOUNGE 👑
Back on Monday, 02-Nov-2026, we identified GHNI as our Top Bullish Pick at 1,151.44, with a buying range of 1,124–1,149 and a short-term target of 1,198.50.
Today, Tuesday, 10-Nov-2026, GHNI tested 1,252, gaining 11.39% from our identified buying range low of 1,124 and 8.73% from the original reference price of 1,151.44.
✅ ST Target 1,198.50 — Achieved
🎯 MT Target 1,297.70 — Next
Our bullish weekly outlook continues to play out, with the medium-term target now in focus.
The levels were shared before the rally. Want the next bullish setup before the move? Join TradeFlow Advisors!
TradeFlow Advisors — Timing Matters
tradeflowsignals.com

5
828
🚀 #SAZEW HITS 1,499.99 — TP1 ACHIEVED#
TRADEFLOW ADVISORS | ELITE MEMBERS
📅 Call Initiated: Wednesday, 28-Oct-2026
Our Call: 1,430.10
Accumulation Range: 1,388–1,430
Low Tested: 1,374.00
Today’s High: 1,499.99
Gain from Tested Low: +9.17%
Gain from Our Call: +4.89%
✅ TP1: 1,490–1,*** — ACHIEVED (ZONE ENTERED)
#SAZEW tested 1,374, just below our identified accumulation range, before staging a strong rebound towards 1,499.99, entering our first target zone.
Our oversold reversal setup, initiated on 28 October, has now delivered its first upside milestone. Sustaining above 1,490 could strengthen the recovery towards 1,***, followed by higher targets.
The setup was identified before the recovery. Want the next opportunity before the move? Join TradeFlow Advisors!
TradeFlow Advisors — Timing Matters!
tradeflowsignals.com

🚀 #GLAXO HITS 342 — TP1 IN SIGHT | +8.29% FROM LOW
TRADEFLOW ADVISORS | BILLIONAIRES LOUNGE 👑
📅 Call Initiated: Friday, 30-Oct-2026
Our Call: 326.01
Buy Range: 320–326
Recent Low: 315.82
Today’s High: 342.00
Gain from Recent Low: +8.29%
Gain from Our Call: +4.90%
GLAXO continues its bullish recovery, testing 342 on Thursday, 05-Nov-2026, following our descending wedge breakout call initiated on 30 October.
The stock has appreciated 8.29% from its recent low and 4.90% from our original call price in just 5 trading sessions, including the call date.
Our bullish breakout outlook continues to play out, with TP1 (345–347) now within reach.
TradeFlow Advisors — Timing Matters!

1
2
796
🚀 #CPHL HITS 65.44 — TP1 ACHIEVED IN JUST 4 TRADING SESSIONS | +16.63% FROM LOW
TradeFlow Advisors | Billionaires Lounge 👑
CPHL continues to deliver on our bullish divergence reversal call shared on Monday, 02-Nov-2026 at 60.85, successfully rebounding from its October low of 56.11.
By Thursday, 05-Nov-2026, the stock tested 65.44, delivering 16.63% appreciation from its October low and 7.54% from our original call price, in just 4 trading sessions
Our anticipated breakout above 63.50–64.00 has played out perfectly, with TP1 (64.05–65.90) successfully achieved.
TradeFlow Advisors — Timing Matters

2
885
🚀 #BOP HITS 32.62 — TP1 & TP2 ACHIEVED | +17.15% FROM LOW
TradeFlow Advisors | Billionaires Only 👑
Back on 29 October, we highlighted BOP’s bullish reversal from its prolonged descending channel at 28.65, identifying the 26.66 zone as a potential reversal bottom.
The stock has now surged to 32.62, delivering 17.15% appreciation from the chart’s measured reference level of 27.84 and 13.86% from our original call price of 28.65.
Both TP1 and TP2 have been achieved, while TP3 (32.00–33.30) is now in progress. The breakout has played out remarkably well, validating our earlier bullish reversal outlook.
TradeFlow Advisors — Timing Matters!

7
1,976