

Visualization Manager @ Facebook exploring the connections between #business, #technology and #design. @tableau #IronViz Champion 2015. Views are my own.
California, USA
Joined July 2010
- Tweets2.4K
- Following1.4K
- Followers2K
- Likes1.5K






Pinned Tweet
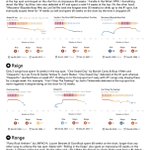
My latest @tableau #dataviz story Charting the Chart Toppers https://teapawt.net/t.co/NrZxwKjdSM analyzes the top singles on the #BillboardHot100 from 1958-2018 using rise, reign and range. Thanks to @HipsterVizNinja for the amazing dataset.


Shine Pulikathara retweeted

It’s always a joy to see @infowetrust in action! Thanks for guiding us on an adventure with data! We so appreciated the opportunity to learn from and be inspired by you!


Shine Pulikathara retweeted

NEW!! 🎉 Super happy to share a new #dataviz project that visualizes how Planet's satellites creates a full image of Earth's landmass in ONE day! 🌍
See how the Earth is slowly build up from each of the whopping 600,000 images taken in a single day 🛰️
nbremer.github.io/planet-glo…
Shine Pulikathara retweeted

What happened on the #Apollo50 moonwalk?
Presenting a 💫new data story with original art, scrolly viz, & animated map. See it on a big screen for a big experience: infowetrust.com/tranquility

Shine Pulikathara retweeted

Here is my @tableau #ironviz entry. Coming from an extremely musical family I dedicate this viz to my 98 year old grandma that still plays the piano every single day!😍
Also huge thanks to @HighVizAbility @FlerlageKev @jreevers5 for all their support!
public.tableau.com/views/The…
Shine Pulikathara retweeted

VISUALISING THE CRICKET SCORECARD 🏏📊
A #CricketWorldCup2019 inspired project to tell the story of a cricket match using data visualisation (data from @cricsheet)
Full write up: sportschord.com/visualising-…
@tableaupublic : public.tableau.com/profile/s… #sportsvizsunday

Shine Pulikathara retweeted

Pie charts are evil. Decoration is bad. There are so many rules in #datavisualization & it takes a long time to learn them all. Once you do, @flerlagekr points out that you then need to learn something even more esoteric and difficult: when to break them.
medium.com/data-visualizatio…

Excellent detailed post about various options to make #dataviz work in desktop and mobile.

New blog! 🎉In which I explain 9 different "Techniques for Data Visualization on both Mobile & Desktop"
Including the more common stacking and scaling to more exotic options such as adjusting locations or even two different charts.
visualcinnamon.com/2019/04/m…

3
Shine Pulikathara retweeted

For a while now, I've been working on 6 new sankey templates. Thrilled to finally share them with the world.
kenflerlage.com/2019/04/more…
Shine Pulikathara retweeted
🎉 NEW!! 🎉 BIG release of my #dataviz-driven visual exploration in collaboration with Google Trends 😃
"Explore how people search on Google to understand the often weird & mysterious behavior of our 🐱 & 🐶!"
whydocatsanddogs.com/
Enjoy exploring & Happy US Pet Day!


Shine Pulikathara retweeted

#IronViz Housing Market Rollercoaster now animated online!!
Check this out 👉 observablehq.com/@ladataviz/….
Many thanks to @vizshine for his work on @observablehq! @tableau @tableaupublic
Shine Pulikathara retweeted

Working on your #IronViz entry and struggling with blank canvas syndrome? Set your pace with examples of analysis, storytelling, and design: tabsoft.co/2HloSAp

If you missed it - here’s one way to animate a Tableau viz online without using the pages shelf

My first @observablehq notebook (https://teapawt.net/t.co/hWDccV8wDh) is a 4-step guide to animating a @tableaupublic #dataviz online. The example I chose to recreate is the Wealth and Health of Nations chart by the inspiring @HansRosling. cc: @tableau
7
Great example of creative problem solving to figure out a way to do this in @tableau

📣 New blogpost: how to build a Bar Chart Race in @tableau
greatified.com/2019/03/20/ho…
This tutorial is not the only solution and perfectible. And I was very inspired and amazed by @jburnmurdoch one 🤩
7
My first @observablehq notebook (https://teapawt.net/t.co/hWDccV8wDh) is a 4-step guide to animating a @tableaupublic #dataviz online. The example I chose to recreate is the Wealth and Health of Nations chart by the inspiring @HansRosling. cc: @tableau

Maybe too soon to bring this up after Pi day but TIL why Tau(τ) might be superior to Pi(π) 🤯. What do you think? tauday.com/tau-manifesto
2
#TableauTip If you don't like the position of a mark label, just click it once and then drag it to the desired position. I find this especially useful for labeling marks in scatter plots.
4
Shine Pulikathara retweeted
This year's #IronViz schedule is here! The first qualifier drops on March 15—are you ready? tabsoft.co/2EInFzh

Shine Pulikathara retweeted
If you are a music fanatic, then @vizshine's analysis of Billboard's Hot 100 will be your new jam. 🎸🎵 Find your favorite hit in his off the charts viz: tabsoft.co/2IV4zeL

Embarking on a journey to learn from @infowetrust how to inspire the world with data. The background is a nod to the first data story that I saw from RJ back in 2015 - the Endangered Safari infowetrust.com/endangeredsa…
