

Options flow, volatility, skew & trade structure. Daily market intelligence powered by https://teapawt.net/t.co/SQhYblukFI
Chicago
Joined April 2026
- Tweets814
- Following112
- Followers203
- Likes1.1K






Pinned Tweet
volAI daily market summary, Mon Nov 16
Broad down day. Only 28.6% of S&P names finished higher and $SPY closed -1.98%. Tech dragged with $XLK -3.38% as chips led lower.
SPY 1W implied vol jumped 4.63 pts to 19.90, while $QQQ 1W IV hit 32.84.
$GPRO led flow at 29.08x its 20-day average volume. The largest outright print was an $18.98M QQQ Dec 18 660 put.
Full surfaces, skew and flow are live in volAI. Tap the profile to get in.
3
98
Closing Market Note | Nov 16
Chips led a broad selloff as the Nvidia slide deepened a day before its earnings, and only staples and utilities finished green.
$SPY 739.89 -1.98%
$QQQ 661.75 -2.73%
$IWM 272.97 -1.69%
$DIA 515.70 -1.47%
Breadth was weak: only 29% of S&P names closed up, and the equal-weight $RSP fell 1.09%. Tech was the drag, $XLK -3.38% with just 11% of its members green. $XLP +0.26% led.
$MU 718.89 -7.82%, $TSM 373.31 -6.43% and $AMD 503.46 -5.74% led chips lower, with $SMH -5.24%. $NVDA 156.10 -4.18% heads into tomorrow's report.
$VIX 23.21, +20.3% on the day.
Front-end vol jumped. SPY 1W ATM IV rose 4.6 vol pts to 19.9%, now well above 1M at 17.7%. QQQ 1W rose 5.2 to 32.8%. 1M 25d put-call skew widened to 7.1 vol pts in SPY and 8.7 in QQQ.
Every tile on today's heat map lives in the volAI terminal. Access sits on our profile.

1
1
98
$CCJ is down 6.33% to ~$66.25, and its options are trading about 3.8x a normal day.
159,063 contracts so far vs a 41,779 one-month average.
Puts: 144,451
Calls: 14,612
Two 67,195-lot put blocks crossed at 11:24 CT: the Mar '27 65 puts and the Sep '27 55 puts.
1M ATM IV: 51.01% → 55.36%
1M 25d put-minus-call skew: 1.57 → 1.58 vol pts
Volume is heavily tilted to puts, while 1M skew hasn't moved. The next earnings date isn't until Feb. 12.
That's CCJ's price and IV on volAI's Symbol Viewer, live. volAI is one tap away on our profile.

1
62
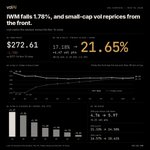
$IWM is down 1.78% to ~$272.61, and small-cap vol repriced from the front.
ATM IV, Friday close → now:
1W: 17.18% → 21.65%
1M: 18.34% → 20.92%
1Y: 20.29% → 20.59%
On Friday the front was the low end of the curve. Now 1W sits above every tenor out to 2Y.
1M 25d put-minus-call skew widened from 4.76 to 5.97 vol pts.
The full IWM curve and skew are a click away in volAI. Our profile has the way in.

3
116
$SPY is down 1.64% to ~$742, and the $VIX futures curve flipped into backwardation today.
Spot VIX: 22.80
Nov future: 21.98
Dec future: 20.68
Dec sits 1.30 pts under Nov, the 4th percentile for that spread since 2014.
The whole curve is higher than a week ago, and the front moved most: Nov +1.94 pts, Jun +0.52.
VIX options price vol of vol at 107.0, the 83rd percentile of its year.
volAI's VIX term structure card maps the full curve. You'll find volAI through our profile.

2
141
A sea of red today, and the chip tiles are the darkest.
$MU -7.1%
$AMD -5.5%
$TSM -5.5%
$ASML -5.0%
$NVDA -4.5%
$AVGO -4.4%
AAPL and MSFT are barely moving, at -0.8% and -0.4%.
The few green tiles are in payments, health care and staples. V is up 0.7% and WMT is up 0.3%.
$QQQ is down 2.4% and SPY is down 1.7%, a day before NVDA reports.
That's the volAI Market Heat Map, live. The terminal sits behind our profile.

2
105
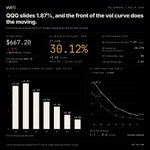
$QQQ is down 1.87%, and the front of the vol curve is doing the moving.
1W ATM IV:
27.69% → 30.12%
1M ATM IV:
24.75% → 26.82%
Out at 1Y, IV is up just 0.54 vol pts.
The 1W-to-3M inversion widened from 4.2 vol pts Friday to 5.4 today.
1M downside skew sits at 7.87 vol pts, and QQQ trades 2.1% below its 200-day average.
Every tenor, live, inside the volAI terminal. Find it on our profile.

2
138
$NVDA reports tomorrow after the close, and options are pricing a 7.5% move.
The Nov 18 expiry, the first one after the report, is trading at 113.4% IV.
Dec 18: 61.1%
Jun 2027: 47.4%
1M IV sits at 62.3%, with an IV rank of 99.
That's with chips sliding for a second day. $SMH is down 4.2% and NVDA is off 2.3%.
Live from volAI's SymbolViewer. The terminal is a tap away on our profile.

See NVDA's full earnings vol surface live in volAI: vol-ai.com

1
476
$XPEV and $BIDU both reported before the open. XPEV is trading close to its priced move. BIDU is well inside its own.
XPEV: +5.9% to $9.93
Implied earnings move (IMPMOVE): 6.08%
Avg move, last 8 reports: 7.01%
BIDU: -2.6% to $76.08
Implied earnings move (IMPMOVE): 5.30%
Avg move, last 8 reports: 5.39%
XPEV's 1M 25d put-minus-call skew went from -1.9 at Friday's close to +5.2 vol pts now. Calls make up 9,570 of the 10,128 XPEV option contracts traded so far.
Every number here came out of volAI. Our profile has the way in.

3
131
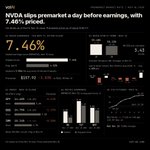
Premarket Market Note | Nov. 16
$NVDA is down 3.03% premarket at $157.92, a day before earnings, as Asian chip stocks slid overnight (Taiwan's benchmark down about 6%, per reports on X). $QQQ is -1.27% premarket and $SPY is -0.63%.
Options price a ±7.46% NVDA earnings move on volAI's IMPMOVE at Friday's close, about 1.86x the 4.02% average move over the last 8 reports.
NVDA vol, Friday close:
1M ATM IV 59.48% (-0.70 vs Thursday)
3M ATM IV 50.23%, curve inverted
1M 25D skew 3.43
1M ATM IV, Friday close (chg vs Thursday):
SPY 14.68% (+0.25) | skew 5.64
QQQ 24.75% (+0.63) | skew 7.18
$IWM 18.34% (-0.12) | skew 4.76
Retail reports this week, IMPMOVE vs past-report avg:
$HD 4.46% vs 2.11% (Tue, before the open)
$TGT 8.41% vs 6.68% (Wed, before the open)
$WMT 5.82% vs 4.85% (Thu, before the open)
$VIX closed Friday at 19.30, just above its Nov. future at 19.12. That contract is down 4.47 pts on the week. FOMC minutes land Wednesday.
The full earnings and vol board lives in volAI, up in our profile.

4
160
volAI daily market summary | Nov 13
Tech dragged, yet 60.7% of S&P 500 names finished green. Equal-weight $RSP +0.19% beat $SPY -0.41%, while $XLK fell 2.07% and Staples $XLP led +1.36%.
$VIX 19.36 (+3.6%), and $QQQ 1W ATM implied vol jumped 2.68 pts to 28.85.
Largest outright block: 950 $SPX Sep '27 7300 puts, $28.93M at $304.54, printed late so aggressor side is unknown (the 20 largest prints overall were all package legs).
All data is sourced from the volAI terminal. Link in bio.
5
317
Closing Market Note | Nov 13
Chips gave it back. Fresh Nvidia worries hit tech and semis slid, with AMD and Broadcom erasing their post-Huang rally, even as most S&P stocks finished green.
$SPY 754.02 -0.41%
$QQQ 679.80 -1.22%
$IWM 277.52 -0.33%
$DIA 523.03 +0.10%
Breadth ran opposite the index: 61% of S&P names closed up, and the equal-weight $RSP +0.19% beat cap-weight SPY. Tech was the drag, $XLK -2.07% with only 27% of its members green. Staples led, $XLP +1.36%.
$AMD 534.05 -8.84% and $AVGO 346.80 -4.78% led chips lower, with $NVDA 162.69 -2.14% heading into Tuesday's earnings. $META 641.87 +2.90% bucked it. $NBIS -9.91% extended its post-earnings slide.
$VIX 19.36, +3.6% on the day.
Front-end vol firmed again. SPY 1W ATM IV rose about 1.2 vol pts to 16.0%, now above 1M at 14.9%. QQQ 1W rose about 2.7 to 28.8%. 1M 25d put-call skew widened to 5.9 vol pts in SPY and 7.6 in QQQ.
Every tile on today's heat map is live in the volAI terminal. The way in is on our profile.

1
3
178
Cross-asset vol check into the Friday close.
1M ATM implied vol vs each proxy's own one-year range, from the volAI terminal's QUERY:
$EWT 43.1%, 87th percentile, up 3.7 vol pts today
$LQD 7.0%, 84th
$IEF 6.7%, 84th
$TLT 12.0%, 80th
$SPY 14.9%, 62nd
$SLV 40.5%, 17th
Taiwan sits near the top of its year, yet EWT's 1M realized vol at 63.3% still runs well above implied. Treasuries and IG credit hold in the upper quartile while silver sits near the bottom.
Full terminal access is up in our profile.

1
77
Downside protection got pricier today in a few names with no earnings for at least a month.
1M 25-delta put minus call skew, from the volAI terminal's QUERY:
$U up about 6 vol pts on the day, now at the top of its one-year range
$UAL up about 6
$URA up more than 5, near the top of its one-year range
U's skew is up more than 9 points in five days.
Link in bio.

4
184
S&P 500 options are trading close to their usual put/call mix today, but a few sectors have drifted well off their own normal.
Puts per call by sector vs each one's 20-session average, in contracts, from the volAI terminal's QUERY:
Health Care 1.07 vs 0.83, 1.29x normal
Communication Services 0.41 vs 0.55, 0.74x
Energy 0.42 vs 0.60, 0.71x
Consumer Staples 0.37 vs 0.59, 0.61x
All S&P 500 members together: 0.69 vs 0.71 normally.
Health Care is the one sector leaning harder into puts than usual, while Staples, Energy and Communication Services are leaning toward calls.
Link in bio.

1
49
Implied vol is climbing in some of today's hardest-hit names.
1M ATM implied vol, change since yesterday's close, on volAI:
$DELL +5.6 pts to 92.7, stock -8.8%
$NBIS +4.7 to 102.9, stock -9.5%
$CRWV +4.5 to 97.0, stock -8.0%
$AMD +4.5 to 69.3, stock -10.6%
DELL also reports Nov 24 after the close, so its front month already carries that event.
Ask the volAI terminal's QUERY for the day's biggest IV risers in plain English and the table comes back in under a minute.
Link in bio.

3
121
Four of next week's big earnings reports are priced well above their own history.
Event-only implied move (IMPMOVE) vs the average move over the last 8 reports, on volAI:
$HD (Tue, before open): 4.25% vs 2.11%, about 2x its history
$TGT (Wed, before open): 8.15% vs 6.68%
$PANW (Wed, after close): 7.35% vs 5.14%
$WMT (Thu, before open): 5.73% vs 4.85%
HD barely moved on its last report (-0.12%). WMT and PANW both moved more than 9% last time: -9.15% and -9.28%.
volAI's event calculator splits each expiry's IV into a base and the earnings piece, so you can see what the options are paying for the report alone.
Link in bio.

2
72
A week ago index vol was spiking. It has now given almost all of it back.
$SPY 1M ATM IV on volAI:
Oct 30 close: 15.3
Nov 6 close: 19.8 (+4.5 pts in a week, vs a 1.0 median weekly change over the past year)
This morning: 15.4
1M ATM IV, last Friday's close vs now:
SPY 19.8 → 15.4
$QQQ 29.4 → 25.7
$IWM 22.6 → 18.7
25D skew eased with it: SPY 9.0 → 6.1, QQQ 10.1 → 7.8, IWM 7.0 → 5.1.
SPY's curve flipped back too. Last Friday it was inverted with 1W at 22.8. At Thursday's close 1W was 14.8 and the curve sloped up to 16.5 at 2Y.
Implied still sits under realized: SPY 1M realized vol is 22.1, 6.7 pts over its 1M IV. QQQ's gap is 10.1, and its 25.7 IV is still in the 91st percentile of its year.

3
115
Same-day options priced a fairly quiet Friday. Less than an hour in, three names have already used up the whole session's priced move.
Move priced for the rest of the session by today's expiry at the open, vs the move since:
$GOOGL 1.13% priced | -2.10% so far (186% used)
$QQQ 0.88% | -1.22% (139%)
$SPY 0.54% | -0.64% (118%)
$AVGO 1.83% | -1.54% (84%)
$NVDA 2.42% | -1.47% (61%)
9 of the 11 names on volAI's priced-move tracker are running ahead of the priced pace with about 12% of the session gone. At fair pricing, about 4.7 of 11 would be ahead at any moment. $AAPL (32% used) and $MSFT (8%) are the two still inside it.
Going in, SPY's budget was 0.74x an ordinary intraday session. NVDA's was the fullest at 0.95x, with earnings Tuesday after the close.

2
92