

Developed trading frameworks for crypto’s liquidity-driven markets. Season 1: Applications Closed.
Global Markets
Joined February 2026
- Tweets158
- Following3
- Followers4.6K
- Likes479




Don't let a few green candles sway your thinking.
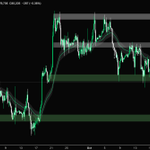
Zoom out. What is the $BTC 4H chart actually telling us?
A clear downtrend, with price continuing to print lower highs and lower lows.
Bitcoin has failed to meaningfully reclaim the $80–81K support zone. Instead, the recent bounce looks more like a retest of former support, potentially confirming it as resistance.
Meanwhile, the Trend Worm continues to slope downwards and act as dynamic resistance overhead.
Until buyers can reclaim these levels and break the sequence of lower highs, there's little reason to change the short-term bearish bias.
A sustained reclaim of $82K would be the first meaningful sign that the structure is shifting.
Keep it simple. Expect further downside until price gives us a reason to think otherwise.


🚨 $BTC BREAKS BELOW $80,000
After nearly a month of range-bound price action, BTC briefly breaks below the $80k support zone.
Repeated failures to reclaim the $84K mid-range have allowed bears to establish a series of lower highs, with selling pressure continuing to build.
The next key level to watch?
A confirmed breakdown below $80K would open the door towards the next major demand zone around $76K–$77K.
For bulls, a swift reclaim of the lost support is needed to avoid further downside.
The range is under threat. Bears are gaining momentum.

Before you take another $BTC trade this week, look at the weekly chart 🚨
Bitcoin has failed to sustain its weekly breakout above $82K, followed by two consecutive bearish weekly closes back inside the range.
The next major support levels to watch are $76.5K, $74K and $72.5K.
Meanwhile, the weekly Stochastic RSI is showing signs of fading momentum, with a bearish cross.
Given the current structure, it makes more sense to maintain a short-term bearish bias until price gives us a reason to reconsider.
For bulls, that starts with a sustained reclaim of $82K, which would begin to challenge the bearish outlook.
Until then, the weekly structure favours caution over optimism.

Bitcoin contunues to repeat 2023 price structure 📈
We've been tracking this fractal since August, and the similarities continue to show.
Both periods saw BTC sweep the range lows, before an impulsive recovery carried price towards major resistance.
Both then broke above that resistance, only to fail to sustain the breakout.
Interestingly, the Trend Worm provided dynamic support throughout much of both recoveries, before price began losing that support as momentum weakened.
Even the RSI tells a similar story, with declining momentum accompanying the deterioration in price structure.
But there's one important difference, so far.
In 2023, Bitcoin swept the previous swing lows before reversing sharply higher. In 2026, the equivalent lows around $74–75K remain unswept.
With BTC momentum struggling, could another liquidity sweep be developing?


$XMR is quietly putting together one of the more interesting charts in the market.
On the daily chart, Monero has established a clear sequence of higher highs and higher lows following its bullish break of market structure in August.
Price continues to trade above its rising moving averages, with the next test around $650–660; break that and there is little between XMR and new ATH's.
But zoom out to the XMR/BTC weekly chart, and things get even more interesting.
After nearly eight years of declining resistance dating back to 2018, Monero has finally broken above its multi-year trendline against Bitcoin.
That's a significant technical development.
Weekly RSI is approaching 70, momentum is strengthening, and XMR is now approaching a major historical resistance zone around 0.0085–0.0095 BTC. A break above this zone and $XMR likely enters a new phase of long-term outperformance.


🚨 $ETH IS BREAKING DOWN
Ethereum appears to be losing a major confluence of support on the daily chart:
1) Horizontal support that has held since August.
2) A potential head and shoulders neckline.
3) The ascending trendline that has supported price since the $1,500 lows in July.
4) The former range resistance that bulls worked so hard to reclaim.
Four key technical levels converging, and bears are threatening to break them all.
Unless ETH can quickly reclaim $2,400, the short-term outlook remains increasingly bearish.
A confirmed breakdown would put the $2,100 region firmly in focus as the next major downside target.
The warning signs were there. Now the bulls need to respond.

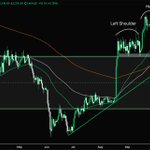
Look away $ETH bulls 🚨 ... a potential head and shoulders pattern is developing on $ETH's daily chart.
The $2,350 region is particularly important, with several technical levels converging:
• Potential head and shoulders neckline
• Rising trendline support
• Daily 100 EMA
Repeated tests of this support, without a convincing bounce, would increase the risk of a breakdown.
For now, support is holding, but the bulls are running out of room for error.

Apollo Trading retweeted

🏆 $500 COMMUNITY GIVEAWAY 🏆
Time for another community giveaway! $500 up for grabs.
To enter:
• Like + repost
• Drop your SOL wallet below
Must be following @ApolloTradingHQ + @ArdiNSC to qualify.
Winner picked next week. Good luck everyone 🤝

Bitcoin is approaching a second consecutive weekly close back inside its previous trading range, following the failed breakout above $83K.
Interestingly, this structure mirrors what we saw at the range lows in June.
Back then, BTC closed below range support but failed to sustain the breakdown, eventually reclaiming the range and rallying towards the highs.
Now, the opposite could be unfolding at the top of the range.
A second weekly close below $83K would strengthen the bearish deviation thesis, with the EMA's below merging as the next key support levels.
The breakout was bullish. The failure to sustain it is not.

Apollo Trading retweeted
This range has only strengthened my conviction that the worst is behind us for $BTC.
Ten attempts to break it down over the last three weeks, and all sellers have managed so far are incremental lows without a sustained breakdown.
Compare that with the move towards $60K a few months ago. A handful of attempts was enough to send entire ranges lower. Supports gave way, liquidations followed, and price barely gave buyers time to respond.
Now we’re less than 10% below the range highs, and sellers are having to work considerably harder for much less progress.
My expectation has been a move into the $70Ks to establish a higher low, but expecting a pullback doesn’t mean ignoring how differently this market is behaving.
You can spend three weeks getting frustrated that support keeps being tested, or ask why those tests still haven’t produced the kind of downside we saw so easily during the bear market.
Personally, I find that encouraging. If buyers are defending this range so persistently, I’m not going to assume they suddenly disappear at lower prices.

🚨 $BTC BREAKS BELOW $80,000
After nearly a month of range-bound price action, BTC briefly breaks below the $80k support zone.
Repeated failures to reclaim the $84K mid-range have allowed bears to establish a series of lower highs, with selling pressure continuing to build.
The next key level to watch?
A confirmed breakdown below $80K would open the door towards the next major demand zone around $76K–$77K.
For bulls, a swift reclaim of the lost support is needed to avoid further downside.
The range is under threat. Bears are gaining momentum.
Despite repeated calls for altseason from your favourite influencer, the broader altcoin market has largely remained range bound since January 2021.
In 2023, altcoins broke their descending trendline alongside a similar breakout in weekly RSI. This preceded a significant rally towards range highs, but ultimately failed to produce a sustained breakout during the last cycle.
Fast forward to 2026, and a similar setup is developing.
Altcoins have recently broken their descending trendline and are now attempting to retest it as support, whilst RSI has also broken its long-term downtrend.
If this marks the beginning of a new bull market, the expectation would be for the range lows to remain intact, with the $440B range highs becoming a longer-term upside target.
However, this is a higher-timeframe structure that could take years to fully develop.
The question is whether altcoins will finally break above this multi-year range, or once again fail at resistance.

We were told "$NEAR to $8" in the replies...
Meanwhile, $NEAR has continued to follow the distribution structure we highlighted, with lower highs and repeated pressure on support.
The warning signs were there. You likely just chose to ignore them.
Price action > opinions & emotion.

$NEAR is showing potential signs of distribution characteristics on the 4H chart.
After repeatedly testing resistance around $5.50–5.60, price briefly broke higher towards $5.90 before quickly returning inside the range. This could represent an Upthrust After Distribution (UTAD).
Since then, we've seen progressively lower highs, weakening price structure and repeated tests of support around $4.60–4.70.
These are characteristics worth watching when identifying potential distribution. If price loses support around $4.50, then the chart likely heads lower to set a higher low pivot on the daily timeframe.

Look away $ETH bulls 🚨 ... a potential head and shoulders pattern is developing on $ETH's daily chart.
The $2,350 region is particularly important, with several technical levels converging:
• Potential head and shoulders neckline
• Rising trendline support
• Daily 100 EMA
Repeated tests of this support, without a convincing bounce, would increase the risk of a breakdown.
For now, support is holding, but the bulls are running out of room for error.
Despite breaking above its previous range, $BTC has repeatedly failed to establish acceptance above the $82.5K–$85K decision zone.
Bears continue to defend this area, preventing BTC from establishing a new, higher trading range.
For now, the move increasingly resembles a range-high deviation, rather than a confirmed breakout.
The daily 50 EMA around $80.8K is currently providing support and keeping the bullish structure alive.
However, the longer BTC continues to test this level without a meaningful bounce, the greater the risk of support eventually giving way.
If the 50 EMA is lost, attention shifts towards the 100 and 200 EMAs, currently sitting around $77K and $76K.

Memecoins are outperforming every other crypto sector today, and it’s not even close.
What’s driving the sudden rotation into memes?

As highlighted in our previous analysis, chasing a 15% rally directly into major resistance was never an attractive entry.
$ZEC has since rejected the $1,360–$1,385 resistance zone and fallen 13% to sub $1200.
Price is now consolidating around $1,230, with the $1,180–$1,200 region becoming an important area to defend.
A successful hold could provide the foundation for another attempt at resistance. However, losing this level would shift attention back towards the range lows around $1,050, where deeper liquidity remains.

The time to get bullish on $ZEC was before the breakout, not after a 15% rally into resistance.
We previously highlighted signs that short-term bearish momentum was fading, before identifying compound breakout long setup on $ZEC.
Since then, price has rallied aggressively, reclaiming the $1,180 breakout level and pushing towards $1,360.
However, this is not the area to suddenly turn bullish. ZEC is now approaching a significant resistance zone between $1,360–1,385, an area that previously acted as support before breaking down.
Late longs entering directly into resistance risk getting caught in a rejection.
The opportunity was at the compound breakout, not after the expansion.
Patience and positioning matter just as much as getting the direction right.

Oil is breaking out, and the implications extend far beyond energy markets 🚨
Brent crude has pushed above a multi-month resistance zone around $112, following months of higher lows and strengthening bullish momentum.
Sustained higher oil prices could reignite inflationary pressures, complicating the outlook for interest-rate cuts and weighing on risk assets.
Oil breaking higher is something crypto traders should be paying close attention to.

Since October 15, Open Interest for $BTC has been making higher highs, while BTC has struggled to establish higher prices.
In other words, leverage is increasing without meaningful upside progress . All whilst aggregated Futures CVD continues to trend lower, indicating sustained aggressive selling pressure.
For now, the data points towards continued downside risk, with the range lows around $80.3K remaining a key area to watch.
However, if buyers successfully defend that support, any shorts accumulated during the decline could provide fuel for a sharp squeeze higher.

$VVV is showing insane relative strength as the broader crypto market dumps 📈
Following a spring below range support, VVV has staged an impressive recovery, reclaiming its 4H trend indicator and breaking above the previous $25.5 resistance.
Price is now consolidating above the $26.3–26.7 support zone, with buyers attempting to establish a higher trading range.
The levels to watch:
• $26.3–26.7 — Reclaimed support bulls need to defend.
• $28.2 — Immediate resistance.
• $30–31 — Major swing high and key level for a broader bullish structure shift.
If $BTC is able to put in a relief rally, $VVV will likely be one of the fastest out of the blocks.

An interesting divergence is emerging between TOTAL3 and the memecoin sector.
$TOTAL3 has broken above its previous swing high, signalling an encouraging shift in market structure across the broader altcoin market.
Memecoins, however, are telling a different story. Despite the recent recovery, the sector remains approximately 62% below its starting reference level, with its major lower-high structure still intact.
Risk appetite may be returning to altcoins, but that capital isn't necessarily rotating into the most speculative corners of the market.
Will they ever recover to prior levels? For now, the chart says no.
