

CMT (Lev I) & Classical Chartist of 10 years | $BTC trader since 2016 | Technical Analysis & Market Structure. Building // @ApolloTradingHQ
Mars
Joined January 2025
- Tweets4.6K
- Following81
- Followers34K
- Likes14.7K




🏆 $500 COMMUNITY GIVEAWAY 🏆
Time for another community giveaway! $500 up for grabs.
To enter:
• Like + repost
• Drop your SOL wallet below
Must be following @ApolloTradingHQ + @ArdiNSC to qualify.
Winner picked next week. Good luck everyone 🤝


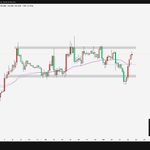
This range has only strengthened my conviction that the worst is behind us for $BTC.
Ten attempts to break it down over the last three weeks, and all sellers have managed so far are incremental lows without a sustained breakdown.
Compare that with the move towards $60K a few months ago. A handful of attempts was enough to send entire ranges lower. Supports gave way, liquidations followed, and price barely gave buyers time to respond.
Now we’re less than 10% below the range highs, and sellers are having to work considerably harder for much less progress.
My expectation has been a move into the $70Ks to establish a higher low, but expecting a pullback doesn’t mean ignoring how differently this market is behaving.
You can spend three weeks getting frustrated that support keeps being tested, or ask why those tests still haven’t produced the kind of downside we saw so easily during the bear market.
Personally, I find that encouraging. If buyers are defending this range so persistently, I’m not going to assume they suddenly disappear at lower prices.


Everyone is becoming increasingly bearish on $ZEC, while I believe we’re approaching the final stages of this correction.
The time to be aggressively bearish was when we lost $1,420. The daily swing structure broke which gave us the basis for our bearish outlook, and we’ve been trading the move lower since.
Now, after weeks of failed rallies, people are losing patience with the idea that this thing can ever go up again.
“Sub-$500 coming.” Blah blah blah.
Imagine following the entire move down, only to become most convinced about the downside towards the lows.
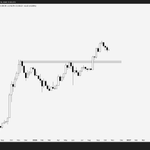
If we lose the neckline of this macro head and shoulders, I fully expect a hunt for liquidity around the prior all-time-high region to complete our corrective roadmap.
But it would not give me a reason to suddenly start calling for much lower prices.
My expectation remains a final leg lower, followed by consolidation and an eventual move higher.


$ZEC
Protect your neck.
Or the prior all-time-high liquidity is next.


This would be the worst-case scenario for $ZEC.
We rally, put in another lower high, then come back to lose $1,100.
That would complete a macro head and shoulders, and I’d expect the liquidity in the older range to get hunted next.
So yes, we can rally from here and still have another substantial leg down ahead. That next rally could be the right shoulder forming.
$1,100 is simply what bulls cannot afford to lose.
We’ve already flushed into the prior range, taken liquidity, and buyers now have the opportunity to build a base.
If we lose that support after another failed rally, I personally wouldn’t expect a shallow correction.
I’d expect a deeper flush into $780-$950, an area I’d strongly favour for a macro bottom.
But as long as $1,100 holds, I still think there’s a strong chance the worst is already behind us.

🏆 $500 GIVEAWAY WINNERS 🏆
Congratulations to our five winners:
@xrp_33hodler
@gem_ilm
@Nalmor2
@McLovinQuant1
@uprivemedia
These giveaways are getting more entries every week, so I’ve got something special planned for the coming weeks leading into Christmas.
🤟
🏆 $500 COMMUNITY GIVEAWAY 🏆
Time for another community giveaway!
$500 up for grabs, with multiple winners being picked.
How to enter:
- Like + repost
- Drop your Solana address below
- Follow @ApolloTradingHQ + @ArdiNSC
Winners picked in 7 days.
Good luck. 🤝

Once you understand market structure and psychology, you start wondering what everyone else is looking at.
Look at the history of $ZEC.
What exactly is this chart doing that it hasn’t done before? Every marked overextension during its euphoric phases has eventually reverted to the mean.
Yet on the run to $1,600, people were trying to convince me that it wouldn’t happen this time and we’d never see $1,000 again.
Now that price has returned to the mean, those same bulls are wondering how much lower it can go, while bears are trying to convince them it’s going to zero.
The market is simply rebalancing after a euphoric overextension.
Expansion, followed by consolidation and reversion.
Reversion, followed by consolidation and the opportunity for another expansion.
You don’t need to be a permanent bull or bear to understand mean reversion.


Sorry, Mr. President.
I can’t hear you over this giant inverse head and shoulders forming on crude oil.
New yearly highs coming soon.


$BTC
A timeline full of people calling for higher and higher.
I'm not so convinced when the range is gradually putting in lower highs and lower lows.
Until we break $84.2K, you simply need to respect that the local swing structure is still bearish.
Break that pivot and we trigger an internal compound breakout. I'll take longs towards the top of the range and look for continuation from there.
Doesn't need to be any more complicated than that.

Ardi retweeted
🏆 $500 COMMUNITY GIVEAWAY 🏆
Time for another community giveaway!
$500 up for grabs, with multiple winners being picked.
How to enter:
- Like + repost
- Drop your Solana address below
- Follow @ApolloTradingHQ + @ArdiNSC
Winners picked in 7 days.
Good luck. 🤝
This would be the worst-case scenario for $ZEC.
We rally, put in another lower high, then come back to lose $1,100.
That would complete a macro head and shoulders, and I’d expect the liquidity in the older range to get hunted next.
So yes, we can rally from here and still have another substantial leg down ahead. That next rally could be the right shoulder forming.
$1,100 is simply what bulls cannot afford to lose.
We’ve already flushed into the prior range, taken liquidity, and buyers now have the opportunity to build a base.
If we lose that support after another failed rally, I personally wouldn’t expect a shallow correction.
I’d expect a deeper flush into $780-$950, an area I’d strongly favour for a macro bottom.
But as long as $1,100 holds, I still think there’s a strong chance the worst is already behind us.
zcash:native
Absolute. F*cking. Silence.
Straight into the $1,100-$1,200 liquidity zone.
I was bullish while the trend held.
I flipped bearish when the structure broke.
Every change of view posted publicly and explained before the move.
Respectfully, how many more times do I have to do this on the same coin before people stop assuming this time will be different?


Tick tock, $NEAR. ⏳

Look at this monthly chart and tell me where the bearish argument is on $NEAR.
A monthly swing failure at the lows.
A break through a five-year downtrend.
Monthly EMAs being reclaimed for the first time in 18 months.
There’s your explanation for why I turned bullish at $3.50.
As long as we hold above that trendline, I’m not going to fight a chart that’s finally doing what bulls spent years waiting for.

Ardi retweeted

$ZEC rally was showing signs of exhaustion well before the recent sell-off.
Each successive breakout delivered diminishing returns:
1st expansion: +78.3%
2nd expansion: +41.5%
3rd expansion: +23.1%
At the same time, price had become increasingly extended above its 200 EMA.
Smaller upside expansions. Increasingly stretched price.
Two clues that bullish momentum was running out of steam.
