

"Put all your eggs in one basket, and then watch that basket closely." Automating by fav #bitcoin charts Work in progress by @ChartsBTC
Joined June 2024
- Tweets4.9K
- Following71
- Followers5.6K
- Likes124




BitcoinChartBot retweeted

Nearly 40 % of all #Bitcoin hasn’t moved in 4+ years.
That leaves < 12 M BTC actually moving and the blue line keeps slipping. Every new buyer is bidding for a shrinking float while the rest is stored as digital gold. 471 trillion of world assets/12 M BTC is ~40 million per coin!⚡️ #HODL #SatifyLife


BitcoinChartBot retweeted
Current Bitcoin price $108,091
4 years ago $38,840 (ROI 178%, CAGR 29%)
8 years ago $2,420 (ROI 4366%, CAGR 61%)
12 years ago $129 (ROI 83887%, CAGR 75%)
#OnThisDate $BTC #BitcoinChartBot


BitcoinChartBot retweeted
Satoshi per Dollar (Sats/USD) on 2025-04-08: 1,305 sats
1 Bitcoin = $76,617 USD
#Bitcoin $BTC #SatsPerDollar #BitcoinChartBot

BitcoinChartBot retweeted
Wtf even is this, and why does it make @JoshMandell6's $444,000 Bitcoin prediction look less crazy?
It's been widely observed that Bitcoin's price growth over the last 15 years follows a power curve--something like y=ax^b--which differs from other common functions, such as linear (y=ax) or exponential (y=ab^x). When the relationship between variables is fundamental (e.g., gravitational force F=Gm₁m₂/r²), we often call it a "power law." I'll leave it up to you to decide if this long-term trend qualifies as a "law," but regardless, I find value in the fit due to its longevity.
Long-term fits in U.S. dollars are skewed by the changing value of the dollar—see "inflation." One way to adjust for this is to measure an asset’s value relative to an inflation-resistant asset, like the price of an ounce of gold. The idea is that gold’s price should rise to offset the dollar’s decreasing value.
Here, I’m measuring the value of the Bitcoin network (market cap) in gold ounces and fitting that value to a power curve. On a log-log plot, a power curve appears as a straight line—see the top left subplot.
My preference is to fit the lower values using a 0.05 quantile regression and treat that as a "support" trendline.
The white line (upper left plot) is the power curve fit of Bitcoin’s market cap in gold ounces. Today’s fit value is 557,039,533 gold ounces.
Since we typically value assets in U.S. dollars, it’s convenient to convert that figure. Knowing the current Bitcoin supply and the current price of gold, we can translate those 557M ounces into dollars:
557,039,533 (gold ounces) × $3,040 (dollar value of an ounce of gold) ÷ 19,839,907 (Bitcoin supply) = $85,353 (BTC-USD fit value).
If you repeat this process for all past days, you get the squiggly white support line in the subplot on the right. It’s not smooth because gold’s price isn’t smooth.
The blue band represents a time shift of the white support line. Simply slide the white support line left by five years. Each white line in the blue band represents a one-year shift.
Doing this, we see that the peak at the end of 2017 (~$20,000) touches the "five years ahead" line. Five years later (end of 2022), the white support line equals ~$20,000.
Not every peak reaches five years ahead, but we did once, so maybe we could again.
So, what’s the connection to Josh? Coincidentally—if you believe in such things—Josh predicted Bitcoin would hit $84,000 a few days ago (which it did) and followed up with a price prediction of $444,000. That sounds crazy, and it is, but it’s also surprisingly close to the "five years ahead" value shown here ($462,557).
Since this fit is relative to gold’s price, gold’s rise from $2,000 (2023) to $3,000 (2025) is pushing the values in the right subplot higher. If Bitcoin’s network value measured in gold continues to follow a power curve, and gold holds its current value, and Bitcoin’s price returns to "five years ahead of support," we could hit Josh’s $444K this year.
That’s a lot of "ifs," but it’s fun, and I want to believe.


BitcoinChartBot retweeted
Do you follow @BitcoinChartBot? I do—after all, I built it! It’s completely automated with randomness baked in, so even I have to follow to see what’s being posted.
Right now, life is hectic, and I don’t have much free time. Hoping things slow down over the holidays! Next on my list: adding automated posting to 🟣🐦 (you know where).
If there’s a chart you’d like added to the rotation, let me know—I’ll work on it when I can!

BitcoinChartBot retweeted
It’s amazing how similar Bitcoin’s cycles have been, but if you’re expecting another top like 2021, you might be in for a surprise. 2021 faced multiple black swans. This cycle could shock everyone to the upside (well, everyone except @Excellion). #Bitcoin

BitcoinChartBot retweeted

😂😂😂 Clearly a big-ole 15 year ponzi / bubble / pump-n-dump!!! Steer clear for sure! Rug pull coming any second! LMAO

BitcoinChartBot retweeted
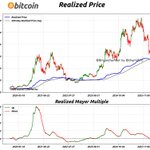
Yesterday end of day: $75,696
Realized Power Law: $53,729
Price is 41% and 53 days above trend
Realized Price: $33,414
Realized is 38% and 449 days below realized trend
#PowerLaw #RPPL $BTC #BitcoinChartBot

BitcoinChartBot retweeted

2024-10-28, 23:59 UTC
192 days after halving
Current: $69,862.52
2012 scaled: $564,523.46
2016 scaled: $88,613.19
2020 scaled: $138,512.56

BitcoinChartBot retweeted
Video update
60-second animation of Bitcoin's power law trend.
Feel free to download and use it as you wish.
Who am I
During the day, I design and deploy systems that allow satellites to communicate with Earth.
I'm anonymous because I'm in the machine. Like it or not, declaring yourself a Bitcoiner still carries a stigma of unseriousness, especially if you have an X account dedicated to the subject.
Being anonymous allows me post from the heart.
I'm a big believer in Bitcoin. I like the idea that we can store value in the cryptographic ether, where it exists without size or mass.
Every week, I stack for my family. Mostly in silence, except for here.
The plots and animations I create are tools I use to evaluate my Bitcoin decisions. For a bit of fun, I add a little polish and share them with you.
I do hope you enjoy and find them useful. I also hope you're saving a bit of Bitcoin for your family.
BitcoinChartBot retweeted

Look at this beautiful pattern.
Bitcoin is currently at $67,803, with the latest ATH at $73,794.
The current drawdown is -8%.
$BTC #Drawdown #BitcoinChartBot

BitcoinChartBot retweeted

The world has a 0.1% allocation to #Bitcoin
Another way to think about this:
1% of the world has a 10% allocation.
99% of the world still has a 0% allocation.
It's still so early for Bitcoin.

BitcoinChartBot retweeted

Comparison of each cycle.
Not because I made the chart but all the other cycle narratives, seem complicated, lost in noise, not based on any solid foundation.
In this one everything is clear, works like a clock (literally) and you know exactly what expect when.

BitcoinChartBot retweeted

Understanding log vs. linear scale is imperative to understanding #Bitcoin. ₿’s growth is so extreme that you really do have to use log scale.

BitcoinChartBot retweeted

I can't help being bullish for 2025
#Bitcoin Bottom to Top vs. 4 & 8 Years Ago
Current Price: $58,955
Price 4 Years Ago: $10,952 (Scaled: $54,186)
Price 8 Years Ago: $606 (Scaled: $54,258)
as of 09/16/2024 $BTC #BottomToTop #BitcoinChartBot
