

Passionate Swing Trader | Market environment is supreme | Not SEBI Registered. YouTube: https://teapawt.net/t.co/OH9GFONTyB
Assam📌
Joined May 2023
- Tweets6.8K
- Following2
- Followers27K
- Likes5K




Pinned Tweet
I created Swing Trading Made Easy to explain swing trading through a clear, practical, step-by-step process.
Learn how everything fits together — not just setups.
If this approach resonates with you, the full learning program is available here 👇
cosmofeed.com/vig/690da6f85a…

Quality Setup Checklist: The only checklist that you need✅
- Leading Sectors
- Stage 2 Stocks
- Linear Price Structure
- Good Contraction Structure Near Confluence/Pivot Zones
- Good Volume Activity near key levels
- Price above Key EMA levels
Few Examples⏬
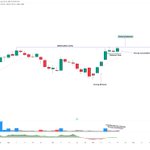
1. AONESTEELS

Disclaimer: The charts shared are for educational purposes only. They are not meant to be buy or sell recommendation.
1
685
For more educational content, Join us⏬
Link: t.me/ChartistEdge

870
Kaushal Thapa retweeted
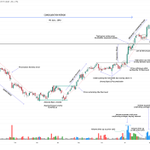
Case Study No.4 #CDSL (Daily Time Frame)
From Downtrend to a Strong Breakout and Expansion ✅
CDSL is a good example of how a stock can transition from a prolonged downtrend into a strong uptrend, followed by an extended consolidation and a volume supported breakout.
💫Downtrend - Selling Pressure Dominates
The stock initially remained in a clear downtrend, forming lower highs and lower lows as seen on the chart.
Price continued to trade below its key EMA levels, indicating that sellers were still in control.
This phase continued until price started finding support around the 1,030 to 1,050 range.
💫Demand Zone - Buyers Start Accumulating
After an extended period of selling, price started stabilizing around the demand zone as seen on the chart.
The earlier supply pressure appeared to be getting exhausted while buyers started accumulating the stock at relatively lower levels.
This was the first important indication that the selling pressure was gradually reducing.
💫Change of Character - Trend Reversal
Price started showing a clear change in character, transitioning from a lower high/lower low structure to a higher high/higher low structure.
The stock began reclaiming its key EMA levels and the improvement in price structure was supported by strong buying volumes.
The shift in trend was becoming increasingly visible through the formation of strong bullish candles.
💫Reclaiming the Gap Zone - Improving Price Strength
As the stock continued to move higher, it approached the earlier gap zone which was acting as a major resistance area between 1,376 and 1,449.
Price managed to reclaim its key EMA levels and continued to build strength below this resistance zone.
Instead of facing aggressive selling pressure, the stock started showing signs of accumulation near the resistance area.
💫A few observations during this period:
Price started moving in a relatively tight range near the resistance zone.
Volumes gradually dried up during the consolidation.
Price action became increasingly tight.
The price managed to hold its improved price structure.
The ability of price to consolidate near a major resistance level without showing significant weakness was an important sign of strength.
💫Breakout - Gap Zone Resistance Taken Out
Price eventually broke above the gap zone resistance with strong bullish candles and increased buying pressure.
The breakout was supported by a significant expansion in volumes, indicating stronger participation from buyers.
This was followed by a sharp expansion phase with price moving decisively above the earlier resistance zone.
The stock moved from the 1,449 breakout area towards 1,748 showing a strong follow through after the breakout.
💫Key Takeaways:
The most important aspect of this formation was the transition from a downtrend to an uptrend followed by an extended consolidation near a major resistance zone.
The exhaustion of selling pressure, formation of a demand zone, change in price structure, reclamation of key EMA levels and dry volumes during consolidation were all important signs of improving strength.
A stock that can consolidate tightly near a major resistance level, with volumes drying up, deserves attention.
When the eventual breakout is supported by strong buying volumes, it can lead to a powerful expansion phase.

Case Study No.4 #CDSL (Daily Time Frame)
From Downtrend to a Strong Breakout and Expansion ✅
CDSL is a good example of how a stock can transition from a prolonged downtrend into a strong uptrend, followed by an extended consolidation and a volume supported breakout.
💫Downtrend - Selling Pressure Dominates
The stock initially remained in a clear downtrend, forming lower highs and lower lows as seen on the chart.
Price continued to trade below its key EMA levels, indicating that sellers were still in control.
This phase continued until price started finding support around the 1,030 to 1,050 range.
💫Demand Zone - Buyers Start Accumulating
After an extended period of selling, price started stabilizing around the demand zone as seen on the chart.
The earlier supply pressure appeared to be getting exhausted while buyers started accumulating the stock at relatively lower levels.
This was the first important indication that the selling pressure was gradually reducing.
💫Change of Character - Trend Reversal
Price started showing a clear change in character, transitioning from a lower high/lower low structure to a higher high/higher low structure.
The stock began reclaiming its key EMA levels and the improvement in price structure was supported by strong buying volumes.
The shift in trend was becoming increasingly visible through the formation of strong bullish candles.
💫Reclaiming the Gap Zone - Improving Price Strength
As the stock continued to move higher, it approached the earlier gap zone which was acting as a major resistance area between 1,376 and 1,449.
Price managed to reclaim its key EMA levels and continued to build strength below this resistance zone.
Instead of facing aggressive selling pressure, the stock started showing signs of accumulation near the resistance area.
💫A few observations during this period:
Price started moving in a relatively tight range near the resistance zone.
Volumes gradually dried up during the consolidation.
Price action became increasingly tight.
The price managed to hold its improved price structure.
The ability of price to consolidate near a major resistance level without showing significant weakness was an important sign of strength.
💫Breakout - Gap Zone Resistance Taken Out
Price eventually broke above the gap zone resistance with strong bullish candles and increased buying pressure.
The breakout was supported by a significant expansion in volumes, indicating stronger participation from buyers.
This was followed by a sharp expansion phase with price moving decisively above the earlier resistance zone.
The stock moved from the 1,449 breakout area towards 1,748 showing a strong follow through after the breakout.
💫Key Takeaways:
The most important aspect of this formation was the transition from a downtrend to an uptrend followed by an extended consolidation near a major resistance zone.
The exhaustion of selling pressure, formation of a demand zone, change in price structure, reclamation of key EMA levels and dry volumes during consolidation were all important signs of improving strength.
A stock that can consolidate tightly near a major resistance level, with volumes drying up, deserves attention.
When the eventual breakout is supported by strong buying volumes, it can lead to a powerful expansion phase.
Kaushal Thapa retweeted
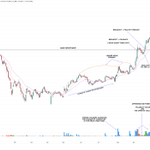
Case Study No.3 #NETWEB (Daily Time Frame)
From Change of Character to a Strong Breakout.
Netweb Technologies is a good example of how a stock can transition from a prolonged period of weakness into a strong uptrend followed by a breakout and a significant price expansion.
💫Change of Character - The First Signs of Strength
The stock initially remained under selling pressure with price trading in a weak structure.
After forming a base around the 1,400 to 1,500 range, the stock started showing signs of strength.
Price gradually reclaimed its EMA levels and strong volumes supported this change in character.
This was the first indication that buyers were starting to take control.
💫Higher Highs - Building a Stronger Structure
Following the change of character, price started forming higher highs and higher lows.
The stock continued to move higher with the 10 EMA acting as a dynamic support during this upmove.
Although there were periods of consolidation and pullbacks, the overall price structure remained intact.
💫Base Formation - Establishing the Major Resistance
As the stock continued to advance, it eventually approached the major pivot point around 3,054.
This level acted as an important resistance because previously from this level the price fell by a lot as seen on the chart.
The formation of higher highs during this phase indicated that buying interest was gradually increasing, even as the stock approached a major resistance zone.
💫Breakout and Pullback - Weak Hands Taken Out
Price eventually broke above the base resistance level.
However, instead of moving higher immediately, the stock experienced a pullback near the breakout zone.
This was an important phase because the pullback helped shake out weaker participants. Price managed to hold the breakout area and subsequently formed a shallow pullback towards the 10 EMA level.
The overall structure remained intact with buyers continuing to defend the important levels.
💫Breakout and Follow-Through - Strong Price Expansion
After the pullback, the stock resumed its upward movement with a strong breakout and follow through.
Volume expanded alongside the price movement, indicating stronger buying interest.
One important observation was the difference between pullback volume and upmove volume.
The pullbacks generally witnessed relatively lower volumes while the upward moves were supported by stronger volumes.
This indicated that buying interest was stronger than the selling pressure during the pullbacks.
💫One-Way Move - Sustained Buying Interest
Once the price cleared the resistance zone and established a strong breakout candle, it entered a sharp expansion phase.
The 10 EMA continued to act as support and the price maintained its upward momentum with very little meaningful weakness.
Price eventually moved towards 4,357 delivering a substantial advance from the breakout zone.
💫Key Takeaways:
The most important aspect of this formation was the sequence of events leading to the breakout.
The initial change of character, strong volumes, formation of higher highs, breakout from the base resistance and a shallow pullback towards the 10 EMA were all important signs of strength.
Another important observation was the difference between volumes during pullbacks and upward moves.
When price advances with strong volumes and pulls back on relatively lower volumes, it can indicate that buyers are in control of the overall structure.
The breakout was only the final part of a structure that had been developing for several months.

Case Study No.3 #NETWEB (Daily Time Frame)
From Change of Character to a Strong Breakout.
Netweb Technologies is a good example of how a stock can transition from a prolonged period of weakness into a strong uptrend followed by a breakout and a significant price expansion.
💫Change of Character - The First Signs of Strength
The stock initially remained under selling pressure with price trading in a weak structure.
After forming a base around the 1,400 to 1,500 range, the stock started showing signs of strength.
Price gradually reclaimed its EMA levels and strong volumes supported this change in character.
This was the first indication that buyers were starting to take control.
💫Higher Highs - Building a Stronger Structure
Following the change of character, price started forming higher highs and higher lows.
The stock continued to move higher with the 10 EMA acting as a dynamic support during this upmove.
Although there were periods of consolidation and pullbacks, the overall price structure remained intact.
💫Base Formation - Establishing the Major Resistance
As the stock continued to advance, it eventually approached the major pivot point around 3,054.
This level acted as an important resistance because previously from this level the price fell by a lot as seen on the chart.
The formation of higher highs during this phase indicated that buying interest was gradually increasing, even as the stock approached a major resistance zone.
💫Breakout and Pullback - Weak Hands Taken Out
Price eventually broke above the base resistance level.
However, instead of moving higher immediately, the stock experienced a pullback near the breakout zone.
This was an important phase because the pullback helped shake out weaker participants. Price managed to hold the breakout area and subsequently formed a shallow pullback towards the 10 EMA level.
The overall structure remained intact with buyers continuing to defend the important levels.
💫Breakout and Follow-Through - Strong Price Expansion
After the pullback, the stock resumed its upward movement with a strong breakout and follow through.
Volume expanded alongside the price movement, indicating stronger buying interest.
One important observation was the difference between pullback volume and upmove volume.
The pullbacks generally witnessed relatively lower volumes while the upward moves were supported by stronger volumes.
This indicated that buying interest was stronger than the selling pressure during the pullbacks.
💫One-Way Move - Sustained Buying Interest
Once the price cleared the resistance zone and established a strong breakout candle, it entered a sharp expansion phase.
The 10 EMA continued to act as support and the price maintained its upward momentum with very little meaningful weakness.
Price eventually moved towards 4,357 delivering a substantial advance from the breakout zone.
💫Key Takeaways:
The most important aspect of this formation was the sequence of events leading to the breakout.
The initial change of character, strong volumes, formation of higher highs, breakout from the base resistance and a shallow pullback towards the 10 EMA were all important signs of strength.
Another important observation was the difference between volumes during pullbacks and upward moves.
When price advances with strong volumes and pulls back on relatively lower volumes, it can indicate that buyers are in control of the overall structure.
The breakout was only the final part of a structure that had been developing for several months.
Kaushal Thapa retweeted
Case Study No.2 #BOSCHLTD (Daily Time Frame)
From Downtrend to a Strong Expansion Phase.
Bosch Limited is a good example of how a stock can transition from a prolonged downtrend into a strong uptrend through accumulation, improving price structure and a strong consolidation structure.
💫Downtrend - Weak Price Structure
The stock initially remained in a clear downtrend with price trading below the 10 EMA and continuing to form lower highs and lower lows.
Selling pressure remained dominant until the price started finding support around the 25,500 to 25,700 range.
💫Demand Base - Early Signs of Accumulation
Price started stabilizing around the demand zone and buying pressure gradually began to build up as shown on the chart.
The stock reclaimed its 10 EMA marking an initial change in character. This was followed by improving price action and a gradual transition from a downtrend to an uptrend.
💫Higher Highs/Higher Lows and Stronger Price Structure
After reclaiming the EMA level, price started moving higher and established a series of higher highs and higher lows.
This was an important development because the stock was no longer showing the same weakness seen during the earlier downtrend.
The overall price structure was improving with buyers gradually gaining control.
💫Undercutting Lows - Signs of Accumulation
During the next phase, price started consolidating around the 29,000 to 31,500 range.
There were instances where price undercut previous lows and the EMA level but managed to close back above them.
This was an important sign of accumulation as the stock was absorbing selling pressure without allowing the overall structure to break down.
💫First Expansion - Strong Demand Takes Control
Price eventually broke above the consolidation range with strong demand candles.
The volume also expanded as price started moving higher indicating increased buying interest.
After this expansion, price began consolidating around the ₹34,675 to 35,805 range.
The structural low remained protected while price continued to coil around the 10 EMA. This showed that the stock was maintaining its strength even after a sharp move.
💫A few important observations:
- Price continued to respect the 10 EMA.
- The lows of the structures remained protected.
- Price started coiling around the EMA near key levels.
- Volume began drying up during the consolidation on the RHS side.
- There were signs of increasing demand as price approached the breakout zone on the RHS side.
💫Breakout and Expansion - Volume Confirms Strength
Price eventually broke above the major pivot point near ₹35,805.
The breakout was followed by a strong expansion phase with price moving higher and volume expanding alongside it.
Even after the initial breakout, price continued to coil around the 10 EMA before making another strong move higher as seen on the chart.
The stock eventually reached ₹40,845, showing a significant expansion from its consolidation range.
💫Key Takeaways:
The most important lesson from this chart is that a strong uptrend does not always begin with an immediate breakout.
The transition from a downtrend to accumulation, followed by a change in price structure, an initial expansion and an extended consolidation provided several signs of improving strength.
The ability of the price to hold its structural lows, respect the 10 EMA and consolidate tightly near the resistance/pivot level was what made this price structure interesting.
When price finally broke out, expanding volumes provided further confirmation of the buying interest.

Case Study No.2 #BOSCHLTD (Daily Time Frame)
From Downtrend to a Strong Expansion Phase.
Bosch Limited is a good example of how a stock can transition from a prolonged downtrend into a strong uptrend through accumulation, improving price structure and a strong consolidation structure.
💫Downtrend - Weak Price Structure
The stock initially remained in a clear downtrend with price trading below the 10 EMA and continuing to form lower highs and lower lows.
Selling pressure remained dominant until the price started finding support around the 25,500 to 25,700 range.
💫Demand Base - Early Signs of Accumulation
Price started stabilizing around the demand zone and buying pressure gradually began to build up as shown on the chart.
The stock reclaimed its 10 EMA marking an initial change in character. This was followed by improving price action and a gradual transition from a downtrend to an uptrend.
💫Higher Highs/Higher Lows and Stronger Price Structure
After reclaiming the EMA level, price started moving higher and established a series of higher highs and higher lows.
This was an important development because the stock was no longer showing the same weakness seen during the earlier downtrend.
The overall price structure was improving with buyers gradually gaining control.
💫Undercutting Lows - Signs of Accumulation
During the next phase, price started consolidating around the 29,000 to 31,500 range.
There were instances where price undercut previous lows and the EMA level but managed to close back above them.
This was an important sign of accumulation as the stock was absorbing selling pressure without allowing the overall structure to break down.
💫First Expansion - Strong Demand Takes Control
Price eventually broke above the consolidation range with strong demand candles.
The volume also expanded as price started moving higher indicating increased buying interest.
After this expansion, price began consolidating around the ₹34,675 to 35,805 range.
The structural low remained protected while price continued to coil around the 10 EMA. This showed that the stock was maintaining its strength even after a sharp move.
💫A few important observations:
- Price continued to respect the 10 EMA.
- The lows of the structures remained protected.
- Price started coiling around the EMA near key levels.
- Volume began drying up during the consolidation on the RHS side.
- There were signs of increasing demand as price approached the breakout zone on the RHS side.
💫Breakout and Expansion - Volume Confirms Strength
Price eventually broke above the major pivot point near ₹35,805.
The breakout was followed by a strong expansion phase with price moving higher and volume expanding alongside it.
Even after the initial breakout, price continued to coil around the 10 EMA before making another strong move higher as seen on the chart.
The stock eventually reached ₹40,845, showing a significant expansion from its consolidation range.
💫Key Takeaways:
The most important lesson from this chart is that a strong uptrend does not always begin with an immediate breakout.
The transition from a downtrend to accumulation, followed by a change in price structure, an initial expansion and an extended consolidation provided several signs of improving strength.
The ability of the price to hold its structural lows, respect the 10 EMA and consolidate tightly near the resistance/pivot level was what made this price structure interesting.
When price finally broke out, expanding volumes provided further confirmation of the buying interest.
✅The monthly candles of all the major indexes are looking exceptionally strong.
Bank Nifty has crossed its ATH while Nifty , Smallcap and Midcap are not far behind.
Mostly, large caps are the benefactor of this positive momentum but soon other sub sectors will benefit from this momentum too after a brief pullback.
If the monthly candle closing is strong then this could potentially turn into a strong leg to the upside.
Exciting times ahead but waiting patiently for strong setups✅

1
25
3,514
Kaushal Thapa retweeted
Opportunities brewing everywhere !!
Keep you watchlist updated ⏬
1. SYMBIOTEC & SMT


