

Passionate Swing Trader | Market environment is supreme | Not SEBI Registered. YouTube: https://teapawt.net/t.co/OH9GFONTyB
Assam📌
Joined May 2023
- Tweets6.8K
- Following2
- Followers27K
- Likes5K




Kaushal Thapa retweeted
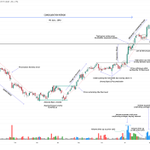
Case Study No.4 #CDSL (Daily Time Frame)
From Downtrend to a Strong Breakout and Expansion ✅
CDSL is a good example of how a stock can transition from a prolonged downtrend into a strong uptrend, followed by an extended consolidation and a volume supported breakout.
💫Downtrend - Selling Pressure Dominates
The stock initially remained in a clear downtrend, forming lower highs and lower lows as seen on the chart.
Price continued to trade below its key EMA levels, indicating that sellers were still in control.
This phase continued until price started finding support around the 1,030 to 1,050 range.
💫Demand Zone - Buyers Start Accumulating
After an extended period of selling, price started stabilizing around the demand zone as seen on the chart.
The earlier supply pressure appeared to be getting exhausted while buyers started accumulating the stock at relatively lower levels.
This was the first important indication that the selling pressure was gradually reducing.
💫Change of Character - Trend Reversal
Price started showing a clear change in character, transitioning from a lower high/lower low structure to a higher high/higher low structure.
The stock began reclaiming its key EMA levels and the improvement in price structure was supported by strong buying volumes.
The shift in trend was becoming increasingly visible through the formation of strong bullish candles.
💫Reclaiming the Gap Zone - Improving Price Strength
As the stock continued to move higher, it approached the earlier gap zone which was acting as a major resistance area between 1,376 and 1,449.
Price managed to reclaim its key EMA levels and continued to build strength below this resistance zone.
Instead of facing aggressive selling pressure, the stock started showing signs of accumulation near the resistance area.
💫A few observations during this period:
Price started moving in a relatively tight range near the resistance zone.
Volumes gradually dried up during the consolidation.
Price action became increasingly tight.
The price managed to hold its improved price structure.
The ability of price to consolidate near a major resistance level without showing significant weakness was an important sign of strength.
💫Breakout - Gap Zone Resistance Taken Out
Price eventually broke above the gap zone resistance with strong bullish candles and increased buying pressure.
The breakout was supported by a significant expansion in volumes, indicating stronger participation from buyers.
This was followed by a sharp expansion phase with price moving decisively above the earlier resistance zone.
The stock moved from the 1,449 breakout area towards 1,748 showing a strong follow through after the breakout.
💫Key Takeaways:
The most important aspect of this formation was the transition from a downtrend to an uptrend followed by an extended consolidation near a major resistance zone.
The exhaustion of selling pressure, formation of a demand zone, change in price structure, reclamation of key EMA levels and dry volumes during consolidation were all important signs of improving strength.
A stock that can consolidate tightly near a major resistance level, with volumes drying up, deserves attention.
When the eventual breakout is supported by strong buying volumes, it can lead to a powerful expansion phase.

Kaushal Thapa retweeted
Case Study No.3 #NETWEB (Daily Time Frame)
From Change of Character to a Strong Breakout.
Netweb Technologies is a good example of how a stock can transition from a prolonged period of weakness into a strong uptrend followed by a breakout and a significant price expansion.
💫Change of Character - The First Signs of Strength
The stock initially remained under selling pressure with price trading in a weak structure.
After forming a base around the 1,400 to 1,500 range, the stock started showing signs of strength.
Price gradually reclaimed its EMA levels and strong volumes supported this change in character.
This was the first indication that buyers were starting to take control.
💫Higher Highs - Building a Stronger Structure
Following the change of character, price started forming higher highs and higher lows.
The stock continued to move higher with the 10 EMA acting as a dynamic support during this upmove.
Although there were periods of consolidation and pullbacks, the overall price structure remained intact.
💫Base Formation - Establishing the Major Resistance
As the stock continued to advance, it eventually approached the major pivot point around 3,054.
This level acted as an important resistance because previously from this level the price fell by a lot as seen on the chart.
The formation of higher highs during this phase indicated that buying interest was gradually increasing, even as the stock approached a major resistance zone.
💫Breakout and Pullback - Weak Hands Taken Out
Price eventually broke above the base resistance level.
However, instead of moving higher immediately, the stock experienced a pullback near the breakout zone.
This was an important phase because the pullback helped shake out weaker participants. Price managed to hold the breakout area and subsequently formed a shallow pullback towards the 10 EMA level.
The overall structure remained intact with buyers continuing to defend the important levels.
💫Breakout and Follow-Through - Strong Price Expansion
After the pullback, the stock resumed its upward movement with a strong breakout and follow through.
Volume expanded alongside the price movement, indicating stronger buying interest.
One important observation was the difference between pullback volume and upmove volume.
The pullbacks generally witnessed relatively lower volumes while the upward moves were supported by stronger volumes.
This indicated that buying interest was stronger than the selling pressure during the pullbacks.
💫One-Way Move - Sustained Buying Interest
Once the price cleared the resistance zone and established a strong breakout candle, it entered a sharp expansion phase.
The 10 EMA continued to act as support and the price maintained its upward momentum with very little meaningful weakness.
Price eventually moved towards 4,357 delivering a substantial advance from the breakout zone.
💫Key Takeaways:
The most important aspect of this formation was the sequence of events leading to the breakout.
The initial change of character, strong volumes, formation of higher highs, breakout from the base resistance and a shallow pullback towards the 10 EMA were all important signs of strength.
Another important observation was the difference between volumes during pullbacks and upward moves.
When price advances with strong volumes and pulls back on relatively lower volumes, it can indicate that buyers are in control of the overall structure.
The breakout was only the final part of a structure that had been developing for several months.

Kaushal Thapa retweeted
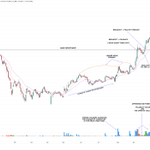
Case Study No.2 #BOSCHLTD (Daily Time Frame)
From Downtrend to a Strong Expansion Phase.
Bosch Limited is a good example of how a stock can transition from a prolonged downtrend into a strong uptrend through accumulation, improving price structure and a strong consolidation structure.
💫Downtrend - Weak Price Structure
The stock initially remained in a clear downtrend with price trading below the 10 EMA and continuing to form lower highs and lower lows.
Selling pressure remained dominant until the price started finding support around the 25,500 to 25,700 range.
💫Demand Base - Early Signs of Accumulation
Price started stabilizing around the demand zone and buying pressure gradually began to build up as shown on the chart.
The stock reclaimed its 10 EMA marking an initial change in character. This was followed by improving price action and a gradual transition from a downtrend to an uptrend.
💫Higher Highs/Higher Lows and Stronger Price Structure
After reclaiming the EMA level, price started moving higher and established a series of higher highs and higher lows.
This was an important development because the stock was no longer showing the same weakness seen during the earlier downtrend.
The overall price structure was improving with buyers gradually gaining control.
💫Undercutting Lows - Signs of Accumulation
During the next phase, price started consolidating around the 29,000 to 31,500 range.
There were instances where price undercut previous lows and the EMA level but managed to close back above them.
This was an important sign of accumulation as the stock was absorbing selling pressure without allowing the overall structure to break down.
💫First Expansion - Strong Demand Takes Control
Price eventually broke above the consolidation range with strong demand candles.
The volume also expanded as price started moving higher indicating increased buying interest.
After this expansion, price began consolidating around the ₹34,675 to 35,805 range.
The structural low remained protected while price continued to coil around the 10 EMA. This showed that the stock was maintaining its strength even after a sharp move.
💫A few important observations:
- Price continued to respect the 10 EMA.
- The lows of the structures remained protected.
- Price started coiling around the EMA near key levels.
- Volume began drying up during the consolidation on the RHS side.
- There were signs of increasing demand as price approached the breakout zone on the RHS side.
💫Breakout and Expansion - Volume Confirms Strength
Price eventually broke above the major pivot point near ₹35,805.
The breakout was followed by a strong expansion phase with price moving higher and volume expanding alongside it.
Even after the initial breakout, price continued to coil around the 10 EMA before making another strong move higher as seen on the chart.
The stock eventually reached ₹40,845, showing a significant expansion from its consolidation range.
💫Key Takeaways:
The most important lesson from this chart is that a strong uptrend does not always begin with an immediate breakout.
The transition from a downtrend to accumulation, followed by a change in price structure, an initial expansion and an extended consolidation provided several signs of improving strength.
The ability of the price to hold its structural lows, respect the 10 EMA and consolidate tightly near the resistance/pivot level was what made this price structure interesting.
When price finally broke out, expanding volumes provided further confirmation of the buying interest.

Kaushal Thapa retweeted
Opportunities brewing everywhere !!
Keep you watchlist updated ⏬
1. SYMBIOTEC & SMT


Kaushal Thapa retweeted
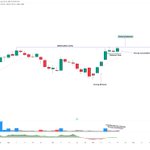
Case Study No.1 #RAMCOSYS (Daily Time Frame)
Ramcosys is a good example of how a change in the overall price structure supported by volumes can lead to a strong breakout.
⭐️LHS Formation - Lack of Buying Interest
The stock initially formed a clear downward structure, with lower highs and lower lows as seen on the chart.
Volumes remained dry throughout this phase suggesting limited buying interest.
Eventually, price established its first demand zone, where selling pressure started to slow down.
⭐️Demand Zone - First Signs of Strength
The demand zone continued to hold and price started forming higher lows. This was an early indication that the existing downtrend was losing strength.
Although, price faced resistance around the second pivot point, the formation of higher lows showed that buyers were gradually gaining control.
⭐️RHS Formation - Change in Price Structure
The stock started showing a clear improvement in price structure as higher lows started forming.
Price reclaimed its EMA levels and managed to sustain above them.
The gap zone continued to hold as support. Buying interest increased during the RHS formation.
Strong green candles indicated urgency among buyers.
This was an important structural shift from the LHS side to the RHS because it showed that the buyers were aggressively taking control of the overall price structure
⭐️Consolidation Near the Pivot Point
Price eventually approached the major resistance zone near ₹575 where it had previously faced strong selling pressure.
Instead of showing weakness, the stock started consolidating near this level where the structural low was protected.
This was a strong consolidation because:
• Volumes remained dry throughout the consolidation.
• 10 EMA acted as a strong support.
• Structural low continued to hold.
• Price repeatedly respected the support zone without showing significant selling pressure.
⭐️Breakout - Expansion in Price and Volume
After a strong consolidation phase, the price finally broke above the resistance zone with strong volumes confirming increased buying interest.
This was a good example of how a strong consolidation followed by a volume-supported breakout can lead to a significant price expansion.
⭐️Trade Management - Identifying the Exit
After the breakout, the stock continued to move higher.
The ideal exit would be on a breakdown of the support level along with the 10 EMA. As long as the price continued to respect these levels, the trade could be managed without exiting early.
The ideal exit point is marked on the chart itself when the price gave a proper breakdown of the support level + EMA level.
Disclaimer: This chart is shared only for "EDUCATIONAL" purposes.

Kaushal Thapa retweeted
Some of the clean "SETUPS" I'm keeping an eye on for this week + potentially next week.
A few names showing some combination of:
• Tight price action
• Clean HH-HL structure
• Strong trend structure
• Support holding well
• Volumes drying up
1. PARAGMILK

Kaushal Thapa retweeted
These are some of the "SETUPS" I'm keeping a close eye on for this week.
A few names showing some combination of:
• Tight price action
• Clean HH-HL structure
• Strong trend structure
• Support holding well
• Volumes drying up
1. ACUTAAS

Kaushal Thapa retweeted
#ACUTAAS ( Daily Time Frame )
Strong Setup in the making.
This price has all the necessary good qualities of a strong setup:
- Good transition from LHS to RHS
- Linear Price Structure on the RHS side
- Strong Volumes as the price goes up and vice versa when the price gives a pullback
- Perfect reversal near the 10 EMA
- Good consolidation structure building up near a key pivot point.
Keep an eye on this setup 🤝

Kaushal Thapa retweeted
One of the Scanners I Use to Find Strong Stocks📝
One of the things I do every week is run a scanner to identify stocks that are showing promising price and trend characteristics.
With hundreds of stocks to look at, going through every chart isn't practical. Having a set of predefined conditions makes the initial selection much easier.
Here's how I've structured my scanner and the reasoning behind each condition.
My Screening Conditions:
1. Price above ₹25
A basic filter to remove the very low priced stocks from my search universe.
2. Price above 50 EMA
I prefer stocks that are trading above their 50 EMA, indicating that price is positioned on the stronger side of its trend.
3. 9 EMA above 21 EMA
This helps me identify stocks where shorter term price momentum is positive and buyers have been showing some recent strength.
4. Price × Volume above 5 Cr
I don't want to spend time analyzing stocks where trading activity is too limited. This condition ensures a reasonable level of daily turnover and makes liquidity an important part of the selection process.
5. Market Capitalization above 300 Cr
This keeps the scanner away from the smallest companies and provides a more manageable universe to work with.
6. Price at least 30% above its 52 week low
I prefer looking at stocks that have already shown some meaningful price appreciation. This condition helps identify names that have moved beyond their previous lows instead of stocks that are still struggling to establish strength.
7. Price within 20% of its 52 week high
I also want to know where a stock stands in relation to its yearly peak. Stocks maintaining closeness to their highs are particularly interesting because they haven't given back a large portion of their previous moves.
However, the Scanner Is Only the First Step.
Once the results are there, I don't immediately start looking for entries.
I spend time understanding what the chart is actually telling me.
A few things I pay particular attention to:
- The quality and strength of the previous upward move.
- Whether the stock is outperforming its sector and the broader market.
- How price reacts when it approaches an important resistance level.
- Whether corrections are becoming progressively shallower.
- Whether selling pressure is reducing during pullbacks.
- Whether the stock is developing a clean and well defined base/structure/contraction etc.
- How it behaves when the overall market comes under pressure.
These observations help me separate stocks that merely satisfy numerical conditions from those that are genuinely worth tracking.
Some names will be discarded immediately. Others might make it to my watchlist but won't be ready for an entry.
I am perfectly fine waiting. A good stock doesn't necessarily present a good opportunity every time you look at it.
What I ultimately want is a collection of stocks with favorable characteristics, where I can observe the price action and prepare for potential opportunities.
The scanner takes care of the initial filtering. The real decision making happens when I start studying the charts.
Finding candidates is relatively easy. Knowing which ones deserve your attention and when to act on them, is a different skill altogether🤝

Kaushal Thapa retweeted
Market Environment is improving gradually.
Most of the moves are in beaten down stocks/large cap stocks/strong earners but the overall market breadth is gradually improving which is a good thing for us as more strong setups will emerge from this.
So, I have started building my watchlist again to see if this strength prevails or not in the near future.
No FOMO as of yet since there are very few setups that are offering Low Risk and High Reward.
Will add more names as they come across my scanner.


Kaushal Thapa retweeted
Want to find tomorrow's market leaders?
Start by studying the past winners.
** 11 EXAMPLES ATTACHED BELOW**
Go back to their charts and look at how they behaved before the major uptrend began.
There are a few things worth paying attention to:
•Strong relative strength compared to the broader market.
• Signs of accumulation and rising volumes.
• Tight price action near the highs/crucial pivot points.
• Smaller price corrections with decreasing volumes.
• Higher highs and higher lows as the trend develops.
• Breakouts from well formed bases followed by strong follow through.
What you will notice is that many of these patterns keep showing up across different market cycles.
The names change, the market environment changes but price behavior often tells a similar story.
Study enough historical winners and you start recognizing the signs before the next leader makes its move.

Kaushal Thapa retweeted
The only type of structure that you need to keep track of in this kind of market.
It gives you:
- Strong relative Strength
- Price above 21/50 ema on DTF
- Price above 30 ema on WTF
- Low volatility
- Strong buying pressure/less selling pressure
Keep it Simple :)
Examples🔽

Kaushal Thapa retweeted
#DEEPA \ #TECHNOCRAF
Took two trades today with small size. The entry details is attached in the images below.
Reason for setup selection:
- Good sectoral strength ( in the case of Deepa as it belongs to the Jewellery sector)
- Good linear price structure
- Strong candlestick formation during volatile market
- Good volume patterns
- Price is above key ema's
And lastly the consolidation structure is clean without any volatility near the pivot zone.
Disclaimer: This is not a buy or sell recommendation. Sharing the chart for educatinal purposes only.


Kaushal Thapa retweeted
Some of the clean + liquid names that are forming a good setup in this dicey market environment.
Most of the names are IPO's as that is the only space which has some good strength in the price structure that it is forming ⏬
1. MONEYVIEW

Kaushal Thapa retweeted
#OPTIEMUS moved 16% today
But why it moved was clear from the recent candlestick structure it was forming.
Here is a little snippet of how we analyzed this setup⏬
Kaushal Thapa retweeted
#MVELECTRO
A short video on how I analyze a setup and plan the entry before taking the trade.
I hope you find something useful here to apply to your own setups🤝
Kaushal Thapa retweeted
Scanning for setups for the coming week ?
Use these simple criteria to build a focused watchlist of A+ setups👇
• Stage 2 Stock
• Linear price structure / Outperforming the market
• Price above 10/21 Ema
• Volume dryness / Expansion of volumes
Price characteristics should be:
• Tight consolidation near pivot point
• Pullback towards 10/21 Ema
• Undercutting 10/21 Ema
• Weak selling pressure near key levels
• Huge demand pressure near key levels
Few examples⏬


Kaushal Thapa retweeted
How Long Should a Contraction Structure Be ?
Here is my take on it ⏬
Using #MOREPENLAB chart as an example here.
Kaushal Thapa retweeted
A few examples of what a "Linear Price Structure" actually looks like:
1. #RATNAVEER
2. #IOLCP
3. #FINCABLES
4. #MARINE
More often than not, these are the kind of setups that will keep on working in any kind of market condition✅


