

YouTube (169.000) | Owner Gerla Whale Group | NFA
Dubai
Joined April 2018
- Tweets13.9K
- Following290
- Followers38.2K
- Likes9.4K
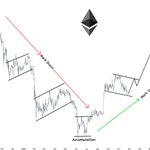





$ETH is gearing up for its next big leg.
This pullback to $2.3K looks like a reset.
I’m expecting a massive expansion.


$HYPE is back at its long-term trendline, with MFI in the same oversold zone seen before the Jan, Apr, and Jul bounces.
I’m bullish on another bounce.

Bitcoin has bounced back after every past US midterm cycle.
History could repeat, and if $BTC holds $80K and buyers step back in, the next recovery could be massive.

$BTC 12-month RSI just did what it did at the 2015, 2019 and 2022 lows. Dropped into the circle, then turned up.
Every one of those marked a cycle bottom zone.

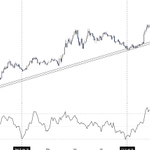
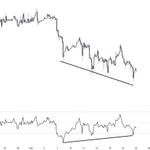
$ETH is showing a bullish divergence.
This could be the start of a stronger move higher.

$BTC is testing the lower flag line at $80K for the third time.
I’m leaning bullish while it holds, but a daily close below $79K breaks the structure.

$ETH is repeating its 2025 pattern, with weekly RSI back near 50 and price testing support.
If the pattern plays out again, another strong rally could be ahead.

Bitcoin whales have accumulated 243K $BTC since July.
Selling pressure is fading, and the bulls may be taking over.


$BTC dominance is rejecting 61% again.
If it drops toward 59.3%, altcoins could be ready to explode.
The door to altseason is opening.

$ETH could be gearing up for its next big move.
A sweep toward $2.2K could shake out weak hands before the recovery kicks in

$BTC could dip toward the $75K demand zone.
RSI isn’t oversold yet, so another drop could create the setup for a strong bounce.

$ETH activity is exploding, but price hasn’t caught up yet.
Velocity just hit 11.03. A reclaim of $2.75K could open the door for the next leg up.

$XRP confirmed its bullish reversal after a bullish divergence and broke its long-term downtrend.
Now it's retesting support. If buyers hold this zone, the next move higher could be coming.


Brent above $100 puts pressure on $BTC.
Higher oil keeps inflation hot and rate cuts harder to deliver. That can tighten liquidity and weigh on risk assets.
If oil cools down, it could support a stronger recovery across crypto.
