

25+ years studying markets. Went full-time. ETF breakouts, theme-first momentum | CANSLIM/VCP/EP style.
Denver, CO
Joined January 2019
- Tweets1.9K
- Following474
- Followers1.8K
- Likes2.2K


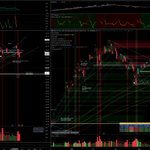


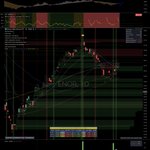

This chart is going around X showing Technology trading at just 19x forward earnings, well below its 5-year average of 25.3x and 10-year average of 23x.
Sounds cheap, right?
But it’s missing a VERY important piece of the valuation equation. INTEREST RATES.
Warren Buffett has long emphasized the relationship between interest rates and stock valuations. One way to evaluate this is to compare the earnings yield (inverse of P/E) to the 10-year Treasury yield.
Let’s compare today’s valuation to the October 2022 bear market low.
October 2022:
Tech forward P/E: 18.8x
Earnings yield: 5.32%
10-year Treasury: 4.00%
Spread: +132 basis points
October 2026:
Tech forward P/E: 19.0x
Earnings yield: 5.26%
10-year Treasury: 5.00%
Spread: +26 basis points
Despite trading at nearly identical P/E multiples, Technology’s earnings yield relative to Treasuries is now 106 basis points LESS attractive than it was at the October 2022 bear market low.
So what multiple would Technology need to trade at today to offer the same earnings-yield spread as October 2022?
Approximately 15.8x forward earnings.
That’s roughly another 17% decline in Technology stock prices from the 19x valuation shown in this chart, assuming forward earnings estimates remain unchanged and the 10-year Treasury stays at 5%.
At 5% Treasury yields, a 19x Technology P/E is nowhere near as attractive as it was in October 2022.

As bearish as I am, I wouldn’t be surprised to see $SOXX and $SMH rally in the next day or two.
$SOXX is testing its 200-day SMA and the long-term trendline connecting the April 2025 and March 2026 lows.
$SMH also coming down to its 200-day SMA but has broken below its trendline connecting the April 2025 and March 2026 lows.
I’d love to see them rally for a few days back toward their declining 21-day EMAs. For $SMH, a rally back to ~$555to$560 area / the broken trendline and the confluence with the 21 EMA would be an ideal short entry. This level would also close this mornings gap.
xitter.cf/ETFbreakouts/status/21…


I'm not buying the $SOXX bottom. I'm looking for the ideal short setup when the inevitable premature "bottom is in" calls start coming.
The failed $IXIC breakout and absolute destruction of leading growth stock charts are telling a very different story.
For the past month, arguably three months, price action has been consistent with a major Stage 3 topping process.
And what follows Stage 3? Stage 4.
Look at the leading growth stocks and industry groups. Breakouts have failed everywhere. Many couldn't even complete their bases before breaking down. The consolidation since June is riddled with gaps. Constructive bases have minimal gaps. Constructive price action is tight and orderly with low volume.
At a minimum, I expect $SOXX to shake out the 7/29/26 low of $464. But that would only represent a ~29% correction from its all-time high.
Historically, $SOXX corrections during these types of late stage breakdowns reach 35–50% before a durable bottom forms.
A 35% correction would put $SOXX around $426, another 14% below Friday's close.
But I think a very reasonable potential bottom is the $350 area.
Why $350?
That's near the lower portion of the prior base, a potentially important support area using O'Neil's historical chart concepts.
It would represent a ~47% correction from the highs (very common for $SOXX during market corrections) and another ~29% decline from Friday's close.
Does this mean we're going straight down? Absolutely not.
Today's 20%+ spike in $VIX makes a relief rally next week a very real possibility. Sharp volatility spikes frequently produce short-term rebounds, especially during major downtrends.
In fact, I'm hoping for exactly that.
Give me a 2–3 day, declining-volume dead-cat bounce into resistance the resistance area I highlighted in my video.
That's the kind of short setup I'll be looking for.
Is this another 2022-type bear market? I don't know. But the price action of leading growth stocks certainly has similarities.
I'm not interested in calling the exact bottom. I'm interested in understanding where we are in the market cycle and finding high-probability setups.
Right now, I think the bigger opportunity may be on the short side.
Let the bottom callers have their oversold bounce. I'll be watching to see whether it fails.

Amazing how many people selling subscriptions and their trading systems on X tonight are now on full margin the AI trade and $SPCX.
I’m 98% cash, been so since Wednesday morning. 80% cash coming into last week.
I could care less if the market goes down 10% this week or up 10% this week.
There are no low risk entries so I’m sitting tight until there are.
One of this market’s leading groups just confirmed a double top.
My custom Technology & Hardware sector includes 70 stocks grouped by where companies actually earn revenue, rather than their GICS classifications.
Optics, storage, memory, servers and other technology hardware (excluding semiconductors). Names like $DELL, $STX, $WDC, $HPE, $AAOI, $ANET, $CIEN and $LITE.
This group has been a leader since the April 2025 Tariff Tantrum lows. Its breakdown deserves attention.
When leaders crack, another growth group needs to take the reins. What I’m seeing take over instead is defensive leadership.
At best, we'll see a correction or another couple months of volatility. At worst, we’re in the early stages of a bear market.
I’m not predicting another 2022. But I’m not dismissing that possibility either. This is a warning to be careful about rushing to buy the dip.
Here’s what I’m watching on the chart:
Thursday’s bullish candle held the 30-week moving average, shown in yellow. That support failed Friday, with price closing below it.
The 40-week moving average, shown in red, sits just below Friday’s low and could provide support for a bounce.
But don’t confuse a bounce with a bottom.
If the breakdown continues, I’m watching the lower portion of the prior base around $185–$195, roughly 18%–22% below Friday’s close.
And if your portfolio fell 20% last week and you’re still fully invested, you need a plan for reducing exposure.
In that situation, I’d use a 2–3 day bounce to sell at least half.
Tops occur when the story is still great but price doesn't continue higher. That's exactly what we have been experiencing int he AI trade since June.
I'm a perma-bull. Look at my timeline. Last time I was this bearish was Feb and Mar 2026.


I saw a post a of a buyer of $INTC on Friday. The chart reminded me of the Start of the 2022 Bear Market.
Not once but 2x. $IXIC on 1/3/22 AND 4/4/22 looks very similar to $INTC on 10/2/26. 4/4/22 was the start of the April waterfall that had my entire office (P.E. Multi-family not stocks) talking about their 401ks.
Be careful and don't be too anxious to buy the dip. This market is not the same market it was between 2023 and early 2026.
I'm not buying the $SOXX bottom. I'm looking for the ideal short setup when the inevitable premature "bottom is in" calls start coming.
The failed $IXIC breakout and absolute destruction of leading growth stock charts are telling a very different story.
For the past month, arguably three months, price action has been consistent with a major Stage 3 topping process.
And what follows Stage 3? Stage 4.
Look at the leading growth stocks and industry groups. Breakouts have failed everywhere. Many couldn't even complete their bases before breaking down. The consolidation since June is riddled with gaps. Constructive bases have minimal gaps. Constructive price action is tight and orderly with low volume.
At a minimum, I expect $SOXX to shake out the 7/29/26 low of $464. But that would only represent a ~29% correction from its all-time high.
Historically, $SOXX corrections during these types of late stage breakdowns reach 35–50% before a durable bottom forms.
A 35% correction would put $SOXX around $426, another 14% below Friday's close.
But I think a very reasonable potential bottom is the $350 area.
Why $350?
That's near the lower portion of the prior base, a potentially important support area using O'Neil's historical chart concepts.
It would represent a ~47% correction from the highs (very common for $SOXX during market corrections) and another ~29% decline from Friday's close.
Does this mean we're going straight down? Absolutely not.
Today's 20%+ spike in $VIX makes a relief rally next week a very real possibility. Sharp volatility spikes frequently produce short-term rebounds, especially during major downtrends.
In fact, I'm hoping for exactly that.
Give me a 2–3 day, declining-volume dead-cat bounce into resistance the resistance area I highlighted in my video.
That's the kind of short setup I'll be looking for.
Is this another 2022-type bear market? I don't know. But the price action of leading growth stocks certainly has similarities.
I'm not interested in calling the exact bottom. I'm interested in understanding where we are in the market cycle and finding high-probability setups.
Right now, I think the bigger opportunity may be on the short side.
Let the bottom callers have their oversold bounce. I'll be watching to see whether it fails.
These are great webinars.

This sunday is the final webinar of @RossHaber's Growth Stock Trading Workshop.
Join us as we discuss how to study market leaders and build model books.
Register here 👇
us06web.zoom.us/webinar/regi…


Video on my thoughts on the market. I don't think today was the low. Price action and charts in individual growth stocks and $XLK $SMH are terrible. $XLP and $XLV and $XLE are rallying.
I'm looking for a short into the now declinig 10 EMA on either $SPY or $QQQ in the next 2-3 days.
98% cash. small positions remain in $MRNA and $HALO. stopped out of everything else on Tuesday. Including major pain in $DELL and $ANET - blew past my stops. Glad I took the loss when I did.
On 9/28/26, I made my biggest trading mistake of the year.
It wasn't ignoring a stop that turned into a big loss.
It wasn't missing a trade that turned out to be a big winner.
Going into 9/28 morning, I was fully invested: $CIBR (6/26 entry), $SKYY (9/17 entry), $CLOU (9/17 entry), $TECL (9/21 entry) and $SOXL (9/25 entry).
I added $SOXL on 9/25 after a very short pivot. An aggressive entry into another highly correlated position. $TECL was also a very aggressive entry after the 9/21 gap up, LOD stop.
In hindsight, that was my first warning sign. After 4+ months of frustrating market action, I was aggressively adding exposure with very little cushion from recent entries.
Shortly before the open on 9/28, $CIBR, $SKYY and $CLOU weren't showing gap down. At the open, all three gapped sharply lower.
It caught me completely off guard. I think that surprise finally pushed months of accumulated frustration into anger.
A few minutes later, $SOXL sold off hard and hit my stop.
My plan for the other positions was clear: wait for the 15-minute opening range low to break before selling. That's my rule for ETF gap downs.
But instead of letting the plan work, I kept flipping through charts. Watching every tick. Getting more frustrated.
Then I snapped.
I liquidated my entire ETF portfolio.
Selling $SOXL doesn't bother me. It hit my stop. Even if that happened to be the low, the exit was correct under my rules.
But $CIBR, $SKYY, $CLOU and $TECL were all profitable. None were close to their stops. None had met my predefined exit criteria.
Breaking my own rules has been 10x more stressful than taking a planned loss or missing a winner I should've bought.
So this morning, instead of reviewing charts, I'm working on trading psychology.
Why did I abandon my plan that has proven profitable? How did months of frustration build into one impulsive decision? And what needs to change so I recognize that state before I start clicking sell?
The longer I trade, the tighter my stops get.
This isn’t a new concept, but I think the biggest advantage of tight stops gets overlooked: POSITION SIZE.
Risk 0.5% of equity with a 2% stop = 25% position.
Risk 1% of equity with an 8% stop = 12.5% position.
Half the position size with TWICE the equity risk.
But here’s where the math really gets interesting.
2% stop:
6% gain = 3R
10% gain = 5R
20% gain = 10R
8% stop:
24% gain = 3R
40% gain = 5R
80% gain = 10R
A 6% gain can happen in 1–3 days with the right entry. An 80% gain is a completely different story.
My goal is for 15% of my trades each year to reach 10R. I get my fair share of 100%+ winners, but nowhere near 15% of my trades.
Yes, tighter stops mean getting stopped out more often. But as my entries and stock selection improve, I’m maintaining a win rate above 30%, and well over 60% in good markets.
At a 33% win rate, averaging 3R winners puts you around breakeven before costs. Everything above that builds your edge.
For me, the goal isn’t to avoid getting stopped out. It’s to keep losses small enough that the winners can really move the needle.
🤖 Made with AI

This feels like an exact repeat of August.
$SPY breaks out of a perfect little flag on 8/13. I’m getting traction, winning over 60% of my trades and building a profit cushion. I add exposure and a bit of margin.
Then the breakout fails. Gains quickly turn into losses.
This time it’s $QQQ.
Nice flag breakout on 10/2. Strong follow-through the next session. Today, it failed to hold the pivot.
The decent profit cushion in my holdings is now gone. Back in the red.
Tops are processes. And this has been a hell of a process since June.
Bear market incoming? I think so. At this point, I certainly hope so.
I’ll let my stops take me out of the remaining positions, then stay in cash.


If you think NASI falling below its March 2026 levels and heading toward the April 2025 lows is bullish, pull up January 2022.
That was the beginning of a brutal bear market.
Oversold can get a lot more oversold.
Chart: @Deepvue


Never get too bearish. Always consider the other side.
My earlier video focused on how most major sectors, except $XLK, $XLV and $XLE, are in Stage 4 downtrends.
Here’s the counterargument: those other sectors are also deeply oversold.
$NYSE is roughly 1% above a major support zone where the 200 SMA lines up with the April 2026 weekly consolidation pivots.
Only 19.9% of NYSE stocks are above their 50 SMA, excluding preferreds, fixed income, warrants, etc. That’s the kind of breadth reading where I start looking for a bounce.
Meanwhile, $XLK, $SMH and $IGV are holding up like a beach ball underwater.
If the weaker sectors find their footing, even temporarily, that could relieve the pressure on tech and allow some big breakouts.
An oversold bounce won’t fix every Stage 4 chart. But it could give the leaders enough room to run.
And there are certainly enough leaders setting up in tech.

$MU delivers a solid beat and guidance above expectations. The stock’s initial after-hours response? Barely a move.
Revenue and adjusted EPS beat consensus by roughly 6%. Next quarter’s guidance midpoints came in roughly 8% above expectations.
Strong numbers. Underwhelming reaction.
Alongside the failed breakouts and deteriorating breadth I’m seeing, this adds to my concern that the market is topping.
On my charts, every sector except Technology is either entering Stage 4 or already in a confirmed Stage 4 downtrend. Bulls need those sectors to participate. An oversold bounce would help, but they have a lot to repair.
I could be wrong. If $XLK gaps up tomorrow and breaks its first 30-minute opening-range high, I’ll buy that breakout.
I’m bearish on the broader picture, but I’ll still take the setup.
I’m turning pretty bearish. It’s getting hard to ignore the combination of deteriorating breadth, rising yields and price action of individual stocks.
Distribution days are piling up:
• NYSE: 9
• $SPX: 6
• $IXIC: 5
• My T1+T2 stock universe: 6
Participation continues to weaken. As of Monday’s close, the percentage of stocks ABOVE their 200-day moving average:
• NYSE: 37.8%
• S&P 500: 42.7%
• Nasdaq: 36.3%
My bearish thresholds are below 40% for NYSE/SPX and 35% for Nasdaq. NYSE is already there. SPX and Nasdaq are getting close.
The SPX 10-day 52-week high/low ratio also fell below 0.50 on September 18. More than twice as many new lows as new highs. First trigger since December 2024. Going back to 2015, this signal has triggered 26 times. 21 times the $SPX was either already in a drawdown >7% or suffered a 7% or greater drawdown over the next 3 months. $SPX is currently 1.9% off the highs.
Meanwhile, Treasury yields are surging. $MOVE broke out last week and is now pushing above last week’s high and through its downtrend from April 2025.
But the price action is what bothers me most. Breakouts squat. They reverse, undercut support, rally just enough to pull buyers back in, then fail again.
Breakout buyers, dip buyers, undercut-and-rally buyers. The tape keeps taking money from all of them.
This is the kind of action I associate with tops. I’m having a harder time treating it as normal consolidation.
