






ALT Distressed senior woman sitting at a table with her head in her hand while pouring a few coins out of her wallet


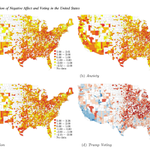
ALT Four heat maps of the continental United States of America showing negative affect and voting in the 2016 Presidential Election. Emotions of fear, anger, sadness, and depression have been demonstrated to serve as a strong predictor of both populist beliefs and higher populist vote share. The first three heat maps provide a spatial distribution for the emotions of anger, anxiety and depression for the years 2009 to 2015. The fourth heat map provides vote share for Donald Trump, successful candidate in the 2016 Election, compared to the baseline average Republican vote share for the years 2000 to 2012. Trump’s vote share appears to be concentrated in many areas where negative affect is highest. The source of the figure is included as full citation for the article “The role of negative affect in shaping populist support: Converging field evidence from across the globe”, published in the journal American Psychologist in 2024.


