

A new perspective on tokenized markets 0x81708aa8bcd4d1eed0a926596cf0a8fd183b213d
Joined September 2026
- Tweets38
- Following1
- Followers27
- Likes0






Pinned Tweet
🚀 Isometric Map 3D is now LIVE on @Pons_Portal!
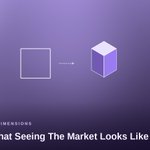
Explore the market from a whole new perspective.
ponsfamily.com/launchpad/0x8…
36 Equities.
7 Sectors.
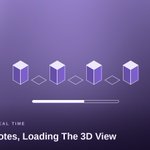
One interactive 3D landscape.
Visualize market size, movement, and sectors through an immersive spatial experience.
Built for the next generation of tokenized markets on Robinhood Chain.
Welcome to Isometric Map 3D. 🗺️

Color marks the sector. Height marks the move. Once you know the legend, the whole map reads itself.

Tokenized markets don't sleep on the usual schedule, so neither does the landscape that tracks them.

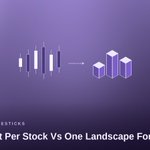
A candlestick chart tells you what happened to one stock. This shows you what happened to all of them, at once.

Hover over any block and the numbers are right there,the shape just gets you looking in the first place.

No two sessions look the same. Every time you open it, the landscape is shaped by whatever actually happened that day.


A spatial lens for tokenized stock markets. explore sectors, inspect stocks, or just watch the shape of the day unfold.


Every session leaves a different landscape behind. Some calm, some mountainous,always shaped by what actually happened.


An independent concept, not official market infrastructure, just a new way to look at data that's already public.


Designed for tokenized equities,because a market that lives onchain deserves a view that isn't just a spreadsheet.


Behind the landscape is every block, a bigger picture. Select one stock and watch it lead the story.

