Isometric Map (@IsometricMap) header
Isometric Map (@IsometricMap) profile picture

A new perspective on tokenized markets 0x81708aa8bcd4d1eed0a926596cf0a8fd183b213d

Joined September 2026
Photo by Isometric Map (@IsometricMap)Photo by Isometric Map (@IsometricMap)Photo by Isometric Map (@IsometricMap)Photo by Isometric Map (@IsometricMap)Photo by Isometric Map (@IsometricMap)Photo by Isometric Map (@IsometricMap)Photo by Isometric Map (@IsometricMap)Photo by Isometric Map (@IsometricMap)Photo by Isometric Map (@IsometricMap)Photo by Isometric Map (@IsometricMap)
Include

Only show posts containing:

Exclude

Hide posts containing:

Time range
-
Minimum likes
Color marks the sector. Height marks the move. Once you know the legend, the whole map reads itself.
1
1
33
Tokenized markets don't sleep on the usual schedule, so neither does the landscape that tracks them.
31
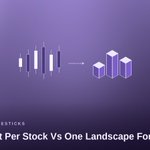
A candlestick chart tells you what happened to one stock. This shows you what happened to all of them, at once.
1
153
Hover over any block and the numbers are right there,the shape just gets you looking in the first place.
1
3
170
No two sessions look the same. Every time you open it, the landscape is shaped by whatever actually happened that day.
1
115
The market, in perspective. One landscape. Every angle. Your move.
1
86
A spatial lens for tokenized stock markets. explore sectors, inspect stocks, or just watch the shape of the day unfold.
1
1
57
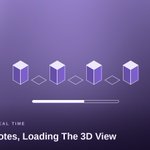
Fresh quotes, loading in real time, building a 3D view of the market as it happens.
1
49
Every session leaves a different landscape behind. Some calm, some mountainous,always shaped by what actually happened.
1
36
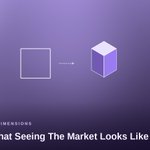
This is what "seeing the market" looks like when you stop flattening it into two dimensions.
1
1
45
Equity quotes plus an optional demo. No trading, no wallet connection, just a different way to see.
1
43
An independent concept, not official market infrastructure, just a new way to look at data that's already public.
1
1
39
X: depth. Y: data. Z: perspective. Three axes, one landscape.
1
1
39
Designed for tokenized equities,because a market that lives onchain deserves a view that isn't just a spreadsheet.
1
37
Markets move. Move with perspective. A spatial lens built for the next generation of markets.
1
3
65
Sort by market cap, top gainers, top losers, or A to Z . same landscape, whichever lens you choose.
1
1
84
Assets in view. Advancing. Declining. Market breadth, visible before you read a single figure.
1
76
One market, a different point of view.every time you select a new stock to follow.
1
1
82
Behind the landscape is every block, a bigger picture. Select one stock and watch it lead the story.
1
3
87
Every stock is a share of the whole map,zoom out and see exactly how much room each one takes up.
1
1
3
115