

Using Composite Cycles & Technical Analysis Successfully to max gains and minimize losses "Confidence is contagious,So is lack of confidence" -Vince Lombardi
Joined October 2010
- Tweets19.2K
- Following70
- Followers1.1K
- Likes8.9K



Pinned Tweet
Look Over My Shoulder
'21 SPY 27.04% JustSignals 92.92% +11 / -1
'22 SPY-19.48% vs 31.06% +13/-5
'23 SPY 24.29% vs 54.73% +11/-4
'24 SPY 23.30% vs 57.47% +12/-6
'25 SPY 16.35% vs 55.67% +9/-1
'26 SPY YTD 13.10% vs 34.77% +7/-3
247
JustSignals retweeted

Day 22 of $QQQ short term down-trend and it is in BWR down-trend; GMI=1 and Red; Beware possible dead cat bounce. ift.tt/NOXCntZ

JustSignals retweeted

Yesterday was an 80% downside day. (There was also an 84% downside day November 5th.) DVOL/(UVOL+DVOL); Lowry’s definition. Data per wsj.com. See cmtassociation.org/wp-conten… for explanation.

JustSignals retweeted

🚨 A WARNING SIGN: Investors now pay $3.50 for every $1 of sales from companies in the S&P 500 — an increase of 67% from the dot-com peak.
JustSignals retweeted

Yes, these next six months are historically quite bullish, but when Congress is fully to the Democrats it turns out the S&P 500 does even better.
Never lower six months later (11 for 11 higher) and up 16.5% on average.

JustSignals retweeted

🚨G-to-the double 00-D; GOOD‼️
When Nasdaq's VIX crosses above 35, typically $NDX is in bottoming phase over the next month 😱
6 and 12 month's later Nasdaq 100 is up 90% of time, median return +12% and +16% respectively 😍
Buy the correction and await ascension 🚀🚀
$QQQ $COMPQ $TQQQ $NVDA $SOXX $SMH $SPY $SPX $DIA $MSFT $AAPL $GOOGL $MAGS

JustSignals retweeted
Seven times a Republican President faced a Democratic Congress.
Up 17.5% on average six months later and never lower for the S&P 500. In fact, strong returns across the board.

JustSignals retweeted

DEMOCRATIC CONTROL KILLED THE STOCK MARKET
Actually…
THIS MIDTERM SETUP HAS A 7/7 RECORD
100% Positive Return.
Republican president.
Democrats control BOTH the House and Senate after midterms.
The S&P 500 $SPY was higher 12 months later every time:
1954: +33.2%
1958: +11.1%
1970: +12.7%
1974: +18.7%
1986: +0.9%
1990: +25.1%
2006: +6.7%
7/7 positive.
Average gain: +15.5%.
Even the stretch that included the 1987 crash finished positive.
“Democrats control Congress, stocks must crash” is a political opinion not what this history shows.

JustSignals retweeted

THE BULK OF NOVEMBER's 15-4, 2.75% MIDELECTION YEAR GAINS HAVE OCCURRED OCT31-NOV10
As I noted in my Oct30 post, which resides in my profile, the S&P is 19-0 since 1950 in the six-month period beginning in November of Mid Election Years for an avg 14.8% gain.
In that study, you can see November participating at a 15-4 clip for a 2.75% avg monthly gain.
Looking in more detail inside the month of November, the vast majority of those gains came in the front half of those months with Oct31-Nov10 going 18-1 for a 2.15% gain and the remainder of the month mixed.
Naturally, in searching for causality for the front end month bullish bias, one can't help but speculate the mid-term elections are possibly an early November contributing factor occurring anywhere from Nov2-8.
As of Nov 3rd, the S&P is down 0.14% for the month and there is, of course, no guarantee that this year will not be different as there are, as you may have heard, other variables beside seasonals influencing the direction of equity indexes.

JustSignals retweeted
These next six months are historically the best of the year, but they are even better in a midterm year.
In fact, 19 for 19 times we've seen November - April higher when starting in a midterm year.
Will this time be different?

JustSignals retweeted
We are leaving the historically worst six months and the next six months are the historically best for the S&P 500.

JustSignals retweeted
Maybe, we are near the end of the world but difficult to ignore this study many are following.
The S&P is 19-0 since 1950 in the six month November-Mid Election through April Pre Election Year time frame for an avg six month gain of 14.79% with worse case performance of 3.52% in 2002-03.
Earnings can certainly trump seasonals, but a short at the end of October is a balsy play.

JustSignals retweeted
Could software really rally another 31%?
@FrankCappelleri with a potentially very bullish chart in his note today.
$IGV

JustSignals retweeted
FOMC TOMORROW
This is the CRAZIEST FOMC stat I found..
Across every completed multi-meeting Fed hiking cycle since 1983, the S&P 500 $SPY finished higher during the cycle.
7/7.
Average gain: ~10%.
100% WIN RATE
And 12 months after the final hike?
7/8 positive.
Average gain: ~20%.
The ONE miss?
May 2000 right as the dot-com bubble was collapsing.
Everyone hears “rate hikes” and thinks stocks have to crash.
History has looked very different.
7/7 during the cycle.
7/8 one year after the final hike.
If history repeats the bottom can be in.


Interesting info for this week…

NEXT WEEK IS THE BIGGEST MARKET TEST OF THE YEAR
Here’s EXACTLY what to look for.
Stocks are already selling off.
The “secret bear market” is already here for investors watching their portfolios get crushed while the indexes hide the damage.
Now look at what hits October 26–30:
WEDNESDAY:
• Fed rate decision + press conference.
• $MSFT $GOOGL $NOW earnings.
THURSDAY:
• GDP.
• PCE inflation.
• Jobless claims.
• $AMZN $INTC earnings.
Also reporting: $SNDK $TWLO and SK hynix.
All with geopolitical risks hanging over the market.
But here’s what makes this week different:
Microsoft, Google and Amazon aren’t just reporting their own numbers.
Their spending plans help drive the ENTIRE AI trade.
Chips. Memory. Networking. Data centers. Power.
Investors want to know:
Is AI demand still accelerating?
Is the spending turning into profits?
And will companies keep spending at this pace?
Then the Fed and inflation data test what investors are willing to PAY for that growth.
If your stocks already feel like they’re in a bear market, this is the week to pay attention.
The question isn’t just whether earnings beat.
It’s whether good news can finally stop the selling.


42
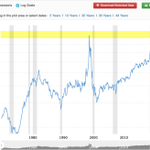
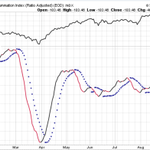
NASDAQ to Dow Jones Ratio:
Interactive chart showing the ratio of the NASDAQ Composite Index to the Dow Jones Industrial Average. A high ratio tends to mark periods of extreme bullishness as high momentum technology stocks attract far more investor funds than more traditional industrial companies as reflected in the DJIA.

1
67
August 31 through October 16 (Friday's close), excluding weekends and Labor Day, is actually 34 consecutive trading days where new lows > new highs.
The research confirms only two prior instances of even a single day where New Lows outnumbered New Highs while the S&P 500 was at or near all-time highs:
1. July 23, 1929 🔴
The last time the S&P 500 advanced at least 1% to within 1% of a new 52-week high while new lows outnumbered new highs was December 21, 1999 — and before that, July 23, 1929, according to Jason Goepfert of SentimenTrader. The 1929 instance preceded the September 3 Dow peak by roughly 6 weeks, and Black Tuesday by about 3 months. The crash that followed erased 89% of the Dow's value by July 1932.
2. December 21, 1999 🔴
It was only the third time since 1990 that the S&P 500 made a new high when there were more new lows than highs, according to BTIG — the two other times both came in December 1999, three months before the dot-com bubble peaked the following March. The Nasdaq subsequently fell nearly 80% by late 2002.
There's also a related data point from May 2026: Jason Goepfert noted it was only the fourth time the S&P 500 hit a record high while 5% of its members fell to fresh 52-week lows — the other occasions being July 1929 and the December 1999 cluster.
The chipmaker selloff is now in its eighth consecutive session — the sector's longest losing streak since the 2008 financial crisis — which is itself a notable internal deterioration signal layered on top of the breadth divergence.
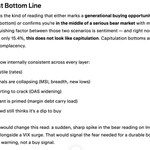
⚠️ Bottom Line
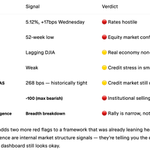
The 1929 and 1999 precedents were one-day occurrences that preceded catastrophic tops. At 34 consecutive trading days, the current episode has no documented historical analog going back to at least the 1920s. The breadth deterioration is now being sustained and deepening simultaneously with a new OAS episode high (325 bps as of Oct 14), a Nasdaq A/D Line still below -700, and the InvesTech A/D Divergence at its worst since 2000 — all converging in the same window.
58
Treasuries rallying while high-yield credit sells off — is a classic flight-to-quality within a risk-off move. Investors are buying the safety of government bonds while dumping corporate credit risk. That's not a "yields are falling because inflation is cooling" story.
57
Yields on risk-free government debt have risen so fast that the Equity Risk Premium has plummeted to roughly -1.5%. This means investors are taking on significant stock market volatility while earning less return than they would by simply holding long-term Treasuries—a rare, dangerous macro environment not seen since the 2000 dot-com collapse.
1
86