

Using Composite Cycles & Technical Analysis Successfully to max gains and minimize losses "Confidence is contagious,So is lack of confidence" -Vince Lombardi
Joined October 2010
- Tweets19.2K
- Following70
- Followers1.1K
- Likes8.9K



JustSignals retweeted

Day 22 of $QQQ short term down-trend and it is in BWR down-trend; GMI=1 and Red; Beware possible dead cat bounce. ift.tt/NOXCntZ

JustSignals retweeted

Yesterday was an 80% downside day. (There was also an 84% downside day November 5th.) DVOL/(UVOL+DVOL); Lowry’s definition. Data per wsj.com. See cmtassociation.org/wp-conten… for explanation.

JustSignals retweeted

🚨 A WARNING SIGN: Investors now pay $3.50 for every $1 of sales from companies in the S&P 500 — an increase of 67% from the dot-com peak.
JustSignals retweeted

Yes, these next six months are historically quite bullish, but when Congress is fully to the Democrats it turns out the S&P 500 does even better.
Never lower six months later (11 for 11 higher) and up 16.5% on average.

JustSignals retweeted

🚨G-to-the double 00-D; GOOD‼️
When Nasdaq's VIX crosses above 35, typically $NDX is in bottoming phase over the next month 😱
6 and 12 month's later Nasdaq 100 is up 90% of time, median return +12% and +16% respectively 😍
Buy the correction and await ascension 🚀🚀
$QQQ $COMPQ $TQQQ $NVDA $SOXX $SMH $SPY $SPX $DIA $MSFT $AAPL $GOOGL $MAGS

JustSignals retweeted
Seven times a Republican President faced a Democratic Congress.
Up 17.5% on average six months later and never lower for the S&P 500. In fact, strong returns across the board.

JustSignals retweeted

DEMOCRATIC CONTROL KILLED THE STOCK MARKET
Actually…
THIS MIDTERM SETUP HAS A 7/7 RECORD
100% Positive Return.
Republican president.
Democrats control BOTH the House and Senate after midterms.
The S&P 500 $SPY was higher 12 months later every time:
1954: +33.2%
1958: +11.1%
1970: +12.7%
1974: +18.7%
1986: +0.9%
1990: +25.1%
2006: +6.7%
7/7 positive.
Average gain: +15.5%.
Even the stretch that included the 1987 crash finished positive.
“Democrats control Congress, stocks must crash” is a political opinion not what this history shows.

JustSignals retweeted

THE BULK OF NOVEMBER's 15-4, 2.75% MIDELECTION YEAR GAINS HAVE OCCURRED OCT31-NOV10
As I noted in my Oct30 post, which resides in my profile, the S&P is 19-0 since 1950 in the six-month period beginning in November of Mid Election Years for an avg 14.8% gain.
In that study, you can see November participating at a 15-4 clip for a 2.75% avg monthly gain.
Looking in more detail inside the month of November, the vast majority of those gains came in the front half of those months with Oct31-Nov10 going 18-1 for a 2.15% gain and the remainder of the month mixed.
Naturally, in searching for causality for the front end month bullish bias, one can't help but speculate the mid-term elections are possibly an early November contributing factor occurring anywhere from Nov2-8.
As of Nov 3rd, the S&P is down 0.14% for the month and there is, of course, no guarantee that this year will not be different as there are, as you may have heard, other variables beside seasonals influencing the direction of equity indexes.

JustSignals retweeted
These next six months are historically the best of the year, but they are even better in a midterm year.
In fact, 19 for 19 times we've seen November - April higher when starting in a midterm year.
Will this time be different?

JustSignals retweeted
We are leaving the historically worst six months and the next six months are the historically best for the S&P 500.

JustSignals retweeted
Maybe, we are near the end of the world but difficult to ignore this study many are following.
The S&P is 19-0 since 1950 in the six month November-Mid Election through April Pre Election Year time frame for an avg six month gain of 14.79% with worse case performance of 3.52% in 2002-03.
Earnings can certainly trump seasonals, but a short at the end of October is a balsy play.

JustSignals retweeted
Could software really rally another 31%?
@FrankCappelleri with a potentially very bullish chart in his note today.
$IGV

JustSignals retweeted
FOMC TOMORROW
This is the CRAZIEST FOMC stat I found..
Across every completed multi-meeting Fed hiking cycle since 1983, the S&P 500 $SPY finished higher during the cycle.
7/7.
Average gain: ~10%.
100% WIN RATE
And 12 months after the final hike?
7/8 positive.
Average gain: ~20%.
The ONE miss?
May 2000 right as the dot-com bubble was collapsing.
Everyone hears “rate hikes” and thinks stocks have to crash.
History has looked very different.
7/7 during the cycle.
7/8 one year after the final hike.
If history repeats the bottom can be in.

JustSignals retweeted

The strongest argument against a market crash is right here.
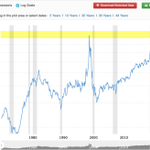
The S&P 500’s PEG ratio has fallen to 0.70, its lowest level on this chart since 1995 and that is far below the levels reached around previous bear markets: 2.0 in 2000, 1.6 in 2007, 2.4 in 2020 and 2.0 in 2022.
The PEG ratio compares the market’s price to earnings multiple with its expected earnings growth ands a falling ratio means investors are paying less for every percentage point of projected profit growth.
Stocks have not become cheap because prices collapsed but they look cheaper because corporate earnings are growing faster than stock prices.
The S&P 500 trades at roughly 19 times forward earnings, down from 22 times at the beginning of 2026 and slightly below its 10 year average while, earnings are expected to grow around 32% for the full year.
Third quarter earnings are projected to rise 29.5%, marking a potential third consecutive quarter above 25% and analysts have also raised that forecast from 26.7% at the beginning of the quarter.
This rally is being supported by rising profits rather than investors simply paying higher multiples.
How could you not stay bullish after hearing this??

JustSignals retweeted
I just found the CRAZIEST market statistic
Use this. It’s the roadmap to get rich.
19 FOR 19
Since 1950, the S&P 500 $SPY has been higher 12 months after EVERY midterm year.
That’s a 100% WIN RATE
19 midterms.
19 times higher.
Average gain: ~15%.
21 FOR 21
Since 1942, EVERY November-through-June period following a midterm has been positive.
21 straight.
Average gain: +16.6%.
YEAR 3 = HISTORICALLY THE STRONGEST
The year after midterms has historically been the strongest year of the 4-year presidential cycle.
Average gain since 1950: ~18%.
So remember:
Market is
19/19 after midterm year
21/21 Positive returns
Year 3 = historically the strongest.
Now you know when to go heavy into the market again.

JustSignals retweeted

My friend @mark_ungewitter noted recently that the NYSE has posted the first requirement of a Zweig Breadth Thrust (ZBT), i.e. a reading below 0.40 for a 10EMA of Adv/(Adv+Decl). To get a ZBT signal, that 10EMA next has to climb above 0.615 within 10 trading days (by Oct. 14). But even if it does not get there, just seeing the dip below 0.40 is a pretty good oversold indication.

JustSignals retweeted

For bears 👀 only:
Are the financials hinting at something here like the last time, at least on the charts?

JustSignals retweeted
🚨 It's. About. To-Go. Down
This morning, the NYSE A/D Line Oscillator will break below -10,000, which historically has led to MORE broad-based selling i.e. Small-caps, Mid-caps, Value and Average stock alongside their indices can express more downside. It gets worse 😩‼️...
Glass half full: This is also the time where price gets its most attractive, best buying opportunity ✅
base:0x38f9bf9dce51833ec7f03c9dc218197999999999 $SPX $IWM $MDY $IJR $SPY $QQQ $NDX $TLT $ES_F $XLK $RUT $COMPQ


JustSignals retweeted

Our Institutional report (excerpts) were posted in Investor Intelligence this morning. investorsintelligence.com/
“We remain aggressively short. As of yesterday’s close, the portfolio was 194.37% short, with a return to date of -0.57% on the short positions. In our assessment, the equity markets remain in a topping process.
The Nasdaq Comp reached a new all-time high on 22-Sep, the W.D. Gann “Day of Infamy,; exceeding its prior 1-Jun high by just 0.36%. This marginal new high coincided with a Gann date and was accompanied by significant negative divergences. Most notably, the S&P 500, S&P MidCap 400, S&P SmallCap 600, SOX, Russell 2000, and advance-decline lines failed to confirm the Nasdaq’s move into new-high territory. We do not want to overanalyze or overtrade. Our aggressive short positioning was established on the basis of pattern analysis, VXN deviations, and cycle theory, and the rationale remains intact.” (24-Sep-26)
[shifting] “We will make portfolio changes based on current market action, cyclic forces, and oversold conditions. Covering IJH, IJR, Reducing exposure in SPY, positioning long TLT. Our oscillator reached a relatively deep oversold reading on 18-Sep and has now reversed to neutral territory. An oversold reading is a prerequisite for a tradable low. We are in a final Montgomery turn cycle period.
We will retain our 37.48% short position in QQQ. We will retain our 19.90% short position in SOXX.
The S&P 500 peaked on the 13-Aug Montgomery date. It declined just 3.95% into 16-Sep and generated a recovery high into the 22-Sep WD Gann date. We will reduce short exposure in the S&P 500 to 75% from the current 103.15%. For tracking purposes we will use VWAP on the day. The reversal in our oscillator off an oversold condition warrants a reduction in short exposure.25-Sep-26)
Milton Berg’s MB Advisors Research Letter, New York, NY miltonberg.com