

Growth Stock Investor. Focused on finding & trading True Market Leaders. Lead PM https://teapawt.net/t.co/xOknKiZTl0 TML Model Portfolio.
Joined August 2014
- Tweets14.8K
- Following98
- Followers92.9K
- Likes6.4K





Pinned Tweet
I'm excited to be working with @TCMLLC & tickermonkey.com to bring the TML Model Portfolio to fruition! This is a service of my passion for finding #TrueMarketLeaders, studying their big moves, capturing the move while applying a set of rules, (1/3)
$GKOS had a Monster PEG (+30% on over 4x average volume on a surprise positive EPS compared to an estimate of a loss) on Thursday.


$CAKE reclaimed the 50-day/10-week line and the 21-day EMA after a shakeout below these moving averages on Wednesday. It closed Friday back above the 111 pivot of its cup with handle.


$EAT reclaimed the 10-week/50-day SMA on Wednesday with a gap up on its earnings report (+12.21% on almost 3x average volume). It was followed by an inside day, then a pullback to retest the 50-day SMA. It may be working on a new base (254.99 standard pivot). See if the 50-day/10-week line will continue to provide support in the next few weeks.


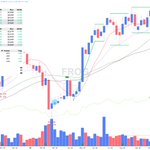
$FROG shook out at the 10-week/50-day SMA as it continued to work on its base. Watch how it acts on earnings next week, 11/5, AMC.


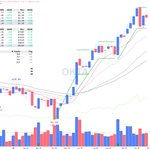
$OKTA slightly undercut the 21-day EMA as it formed on a high, tight flag (235 standard pivot, pole length: 84.2%, flag depth: -21.9%. See if the 200 Century Mark will provide support.
Charts courtesy of @MarketLens_


Weekend Review, 11/1: 0% to 20% Exposure
It was a split weekly and monthly finish for the major indexes.
Nasdaq, Nasdaq 100 ETF QQQ, S&P 500 and QQQE remained below their intermediate term 50-day SMA.
The Equal Weighted S&P 500 Index RSP led with 4 consecutive up weeks as it regained most of the losses from September.
$QQQ $SPY $RSP
Charts courtesy of @tradingview


$SHOP consolidated in a tight range just below the 182.19 all-time high from almost a year ago in October 2025. It formed a 3-weeks tight pattern with an inside week along with a handle (180.88 standard pivot). EPS on 11/3, BMO.


$FROG regained the 50-day/10-week line last week after slicing below the intermediate term moving average two weeks ago. It closed back above the 100 Century Mark on Friday as it continued to consolidate in a base (105.76 standard pivot, 103.39 early pivot). EPS on 11/5, AMC.


$CRWD undercut and reclaimed the 10-week/50-day SMA, then regained the 21-day EMA on above average volume on Friday. It may be working on a new base, but see if the 21-day EMA will provide support.


$DDOG shook out and found support at the 10-week/50-day SMA after a failed breakout over 292.72 cup base. It formed a cup with high handle (300.68 standard pivot). EPS on 11/4, BMO.


$XP undercut then reclaimed the short term 8-day EMA as it tested the top of its Monster Gap. It formed a high, tight flag (32.73 standard pivot, pole length: 97.4%, flag depth: -12.1%).


$ADI pulled back to test the 10-week/50-day SMA. It formed a cup with handle (422.67 standard pivot).


$SN cleared the 194.54 pivot of a cup base on below average volume. It finished at an all-time weekly closing high. Weekly chart showed accumulation with 6 consecutive up weeks from the bottom of its current base. EPS on 11/4, BMO.


$ANF cleared the 155.22 pivot of a shallow cup / flat-tish base and the top of its Monster PEG on below average volume. It pulled back on Friday to test the pivot and the short term 8-day EMA. See if it forms a high handle.


$LLY closed back below the 1292.65 pivot and the 1300 level after clearing these levels on Thursday. It pulled back to test the short term 8-day EMA. See if it can rebound from here or if it forms a short high handle ahead of earnings next week, 10/29, AMC.
Charts courtesy of @MarketLens_


Weekend Review, 10/25: 20% to 40% Exposure
Major indexes are below their intermediate term 50-day SMA.
RSP is an exception as it leads the recovery effort, regaining the 50-day/10-week lines and forming the right side of a 7.3% deep base.
Distribution Days: 3 - Nasdaq, 6 - S&P 500.
$QQQ $SPY $MDY $IWM $RSP
Charts courtesy of @tradingview


$SPCX had a mini-gap down on Thursday below the 150 level, then closed back above the 50-day line on what appeared like a shakeout, It traded with an inside day on Friday, just below the 50-day line. See how it acts on earnings next week, 10/20, AMC.


$XP had a Monster Gap + Day 2 Higher High on 10/5 (+D2HH +30.93% on almost 7x average volume) as it traded at a new 4-year high. Brazilian stocks gapped up on geopolitical news. It gained 49.86% two weeks ago, then pulled back last week as it undercut the short term 8-day EMA.

