

@WxProbe
🇺🇸Account based in
About this account
- Account based in
- United States
- Connected via
- United States App Store
Account-level information from X, not a live location or the device used for a specific post.
Tony Brite Hurricane Expert Former NWS meteorologist & NHC intern Most experienced USA hurricane chaser 46 hurricane eyewalls/19 majors
Eastern NC
Joined May 2026
- Tweets567
- Following177
- Followers2.1K
- Likes1.3K


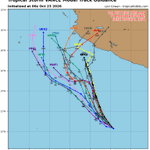


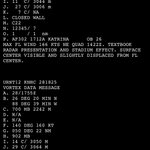


Hurricane Patricia Reanalysis — Was the Historic Peak Even Stronger?
This continues the Category 5 series (Eastern Pacific in this case) with a very thorough analysis of all available data to determine the best single intensity estimate.
Official NHC (TCR) — 23 October 2015
Winds: 185 kt (215 mph)
Pressure: 872 mb
Location: Eastern Pacific (southwest of Manzanillo, Mexico)
WxProbe Reanalysis:
MSW: 190 kt
MSLP: 872 mb
Reconnaissance
Patricia’s absolute peak intensity occurred during an 11-hour reconnaissance gap. During that interval, the satellite presentation (ADT CI) continued to improve through 1200Z. Here’s the pertinent data:
0446Z AF303: 894 mb raw (center sonde 25 kt → adjusted to 891 mb), max flight-level wind of 179 kt at 4 n mi.
0646Z AF303: 885 mb raw (center sonde treated as 57 kt in TCR → adjusted 879 mb), max flight-level wind of 192 kt at 3 n mi (including 1-second spike of 201 kt). Real-time SFMR of 182 kt; post-processed SFMR peaks to 187 kt (Henning et al. 2016; Klotz reanalysis). RMW contracted to 3 n mi.
The aircraft departed while the storm was still deepening. These are the respective observations when recon next sampled the core:
1733Z NOAA3: max flight-level wind was still 192 kt at 8 n mi (VDM; secondary summaries list 191 kt), operational SFMR 166 kt revised to 180 kt after HRD brightness-temperature reprocessing, pressure already higher (VDM at 883 mb with 45 kt → adjusted to 878 mb). Early ERC signatures present.
2044Z: 910 mb with 68 kt → adjusted to 903 mb; flight-level wind of 160 kt. Rapid filling well underway.
The observed rates while aircraft were present taking into consideration the estimated lowest pressure of 872 mb at 1200Z:
* 0446Z–0646Z (2 h): pressure −6 mb/hr, flight-level wind +6.5 kt/hr, RMW 4 to 3 n mi.
* 1200Z–1733Z (5.55 h): pressure +1.1 mb/hr (872 → 878 mb).
* 1733Z–2044Z (3.2 h): 8 mb/hr filling rate once ERC matured.
Pressure
Adjusted pressure at the 192 kt pass was 879 mb. The satellite organization continued to improve until 1200Z. A moderated continuation of the pre-gap −6 mb/hr rate (1.3 mb/hr, which is 22% of the observed rate) across the 5.2 hour gap produces 872 mb at 1200Z. This connects directly to the next observation: 872 mb → 878 mb at 1733Z = +1.1 mb/hr, matching the precisely calculated slow initial filling rate. Anything deeper than 872 mb is possible, but not assured.
Structure
As shown above, the RMW contracted to an astoundingly small 3 n mi at the 192 kt maximum (pinhole). In addition,
mean of the nonzero R34 was compact at 110 n mi, with hurricane-force winds only to 15–16 n mi from the center.
Single wall at peak. No size veto required.
Reduction Factor
A radius of maximum wind of ≤ 5 n mi and pressure below 900 mb support the 0.95 bin (Powell et al. 2009; Patricia SFMR-to-flight-level ratios of 0.95). Patricia’s values were obviously well-below those thresholds.
Flight-level interpolation (single undersample step):
Pre-gap rate was +6.5 kt/hr. A continuation of *only* +1.2 kt/hr (18% of the observed rate) for 5.2 hours = +6 kt. This translates as
192 kt → 198 kt at 1200Z.
Return leg: 198 kt → 192 kt at 1733Z = −1.1 k/hr, consistent with the +1.1 mb/h slow filling while the flight-level wind remained at 192 kt.
These equate to 198 kt × 0.95 = 188 kt → 190 kt, constrained by the measured SFMR values already in the 180–187 kt range. The undersample step is counted once via the interpolation, and 198 kt is the conservative end of that single step. I’ll add that the 192 kt /187 kt pair (ratio of 0.97) and other observed SFMR-to-flight-level ratios near 0.94–0.95 indicate that a higher combination — 202 kt flight-level with a 0.96 factor — would yield 195 kt. This remains a possible high-end, but is not assured. Without direct sampling in the peak window, it isn’t an advisable choice under the methodology, which caps the factor at 0.95 and publishes the conservative single-step result.
Pressure Check
KCZ on 872 mb and the compact R34 is consistent with the upper end of the observed range.
Final Estimate:
MSW: 190 kt (220 mph)
MSLP: 872 mb
RMW: 3 n mi
Time: 1200 UTC 23 October 2015
That is a 5 kt revision of the official wind, while pressure remains unchanged. This further solidifies Patricia’s place as containing the most extreme intensity ever reliably measured in a tropical cyclone, worldwide.
Framework Notes
The flight-level-to-surface factor is selected by the radius of the sampled wind maximum, with pressure and outer size able to veto that first guess. In the most compact cores (RMW ≤ 5 n mi and pressure under 900 mb), the factor can reach 0.95. This ceiling is supported by Powell et al. (2009) and by the Patricia 2015 observations themselves (Rogers et al. 2017; Henning et al. 2016; NHC TCR), where SFMR-to-flight-level ratios reached 0.95. The operational mean remains at 0.90 (Franklin et al. 2003). A small RMW does not justify the highest factors if the mean of the nonzero R34 quadrants is on the order of 140 n mi, or an outer eyewall is active. An undersample of peak intensity is counted once only. Knaff–Zehr–Courtney (KZC) is used as a consistency check. The hour is assigned to the locked apex pair.
Sources: NHC TCR (Kimberlain et al. 2016); Henning et al. (2016) AMS preprint; Rogers et al. (2017) BAMS; HRD SFMR reprocessing (Klotz); vortex data messages 0446Z, 0646Z, 1733Z, 2033Z.


11 Years Ago: Revisiting Hurricane Patricia’s Historic Peak
Yesterday morning marked 11 years since Hurricane Patricia reached its historic peak — the most extreme intensity ever reliably measured in a tropical cyclone, worldwide.
Consequently, I have prioritized a very thorough reanalysis of all available data to determine the best single intensity estimate, consistent with the ongoing Category 5 series. The post will examine the observed rates, structural details, and what likely occurred during the reconnaissance gap when #Patricia reached its apex.
I hope to have the reanalysis completed and released later this evening.
Two quick points: 1) I agree that the physics-based models are still valuable and 2) no singular model will ever be infallible.
That said, there wasn’t *that* much difference in the track errors between the two (physics vs AI) over the past seven days. It is just magnified simply because #Champi made an unpredictable dramatic wobble towards land. Even if the disparity in this case were greater, it wouldn’t override the overwhelming superiority in track performance of the AI models throughout this season. But again, I still find value in the physics-based guidance as well.
In short, they each have their relative strengths and weaknesses, and that should always be taken into consideration when producing a forecast. The NHC has recently been weighting GDMI a little too heavily right now. Recent East Pacific discussions make that clear: the official track is repeatedly and consistently described as lying closest to, closely follows, or in best overall agreement with, the Google DeepMind ensemble mean and HCCA. In practice, the forecast has often mirrored that guidance rather than fully synthesizing the suite.
GDMI has earned significant weight through strong track performance this season, and physics-based models remain imperfect. But every system still has their relative strengths and failure modes. When the official forecast tracks the leading AI guidance this closely, it also inherits those biases rather than being checked by the dynamical models that still handle certain processes (terrain interaction, intensity evolution, specific steering regimes) better in individual cases. Consequently, I feel no single model — or heavily weighted pair — should necessarily dominate the process.


Physics models were a little too far left, but overall had the right idea for #Champi. AI models had to make larger adjustments, and missed the Taiwan impacts. Goes to show that we still definitely need the physics-based models for now, and the AI models have room to improve, which I'm sure they will!
One year ago this morning, NHC Discussion #8 and the concurrent WxProbe update were issued on the still heavily-sheared Tropical Storm #Melissa. Here’s what each of us were expecting:
Forecasts valid 1800Z 26 & 27 October 2025:
NHC (interpolated from 23 Oct):
26/1800Z — 16.8N 76.5W/ 95 kt
27/1800Z — 17.0N 77.5W/ 110 kt
WxProbe (23 Oct):
26/1800Z — 16.8N 77.7W/ 130 kt
27/1800Z — 17.1N 79.2W/ 145 kt
Actual (NHC best track):
26/1800Z — 16.3N 76.9W/ 120 kt
27/1800Z — 16.4N 78.3W/ 155 kt
The verified track essentially split the difference: NHC was too slow and too far east, while the WxProbe forecast was too fast and too far west. Intensity tracked much closer to, and very near, the WxProbe numbers. That stronger-and-more-west versus more-conservative-and-more-east contrast was a consistent theme in the respective forecasts throughout the event.
#Hurricane Melissa first reached Category 5 intensity at 0900Z on the 27th — precisely in the window predicted in that October 23 update — while the contemporaneous NHC forecast from that morning still only projected 105 kt (Category 3) at that same hour and had only 115 kt a full day later. Even as late as 1500Z on the 25th (Discussion 17), NHC was forecasting a peak of 135 kt and explicitly stated they were not yet ready to call for a Category 5, citing ongoing track uncertainty. By the 2100Z advisory that evening (Discussion 18), they had finally raised the forecast peak to the 140 kt Cat 5 threshold.
Expectations of earlier improving environmental conditions and the development of a well-defined inner core allowed for the stronger solution. That much earlier call for rapid intensification south of Jamaica once conditions became more favorable proved directionally correct on both timing and magnitude, even if the precise longitude still needed refinement at the 72–96 hour range.
The NHC’s more easterly and slower-intensifying solution underestimated both the rate and the ultimate magnitude of strengthening once the shear relaxed, remaining 25–45 kt too low at the 26–27/1800Z times and still only calling for a 115 kt peak a full day after Melissa had already reached Category 5 strength. This is an example of where the NHC intensity forecasts have historically shown a conservative bias in some rapid-intensification cases when track or shear uncertainty remains elevated.
Specific WxProbe forecast from compromised/inaccessible account:
xitter.cf/Mr_XMusk27/status/1981…


A Tropical Disturbance Destined for History
Exactly one year ago today, a tropical disturbance was classified as a tropical storm. Its name was #Melissa. Just one week later, it would become one of the strongest western hemisphere hurricanes on record. Although weakening from that peak, it subsequently made a catastrophic Category 5 landfall on western Jamaica about 4–5 hours thereafter.
Given the exceptionally favorable environmental conditions in the northwestern Caribbean, a historic Cat 5 peak intensity seemed probable even while it was still a struggling, sheared, and weak tropical storm. The progression looked like this:
* Late October 20 EDT: While it was still Invest 98L, a track into the northwestern Caribbean already raised the odds of not just a major hurricane but a Category 5 peak, given the highly favorable thermodynamic environment.
xitter.cf/Mr_XMusk27/status/1980…
* October 21 EDT: After classification as a still heavily-sheared tropical storm, the Cat 5 probability was assessed at no less than 50% if the NW Caribbean track materialized, and that track was described as becoming increasingly probable.
xitter.cf/Mr_XMusk27/status/1980…
* October 22 EDT: With the system still a minimal, struggling tropical storm, the intensity ceiling under the favored NW Caribbean track was noted as extraordinarily high — conceivably approaching Atlantic basin records for lowest pressure and/or maximum sustained winds — while a Category 5 was called the most likely outcome (~60%).
xitter.cf/Mr_XMusk27/status/1981…
Note: the linked posts are from my prior account, which was compromised and is no longer accessible. Please do not reply or engage there. The screenshots are also attached for reference.
Once vertical wind shear eased and Melissa moved into the northwestern Caribbean, the storm rapidly intensified to a peak of 190 mph/892 mb before its aforementioned Category 5 #hurricane landfall in western Jamaica — aligning with the high ceiling noted in those early posts.

Melissa Likely to Stay South of Jamaica and Become a Category Five Hurricane by Monday Evening:
Although tropical storm #Melissa remains a heavily-sheared and vertically misaligned system, it’s this lack of structural integrity that will likely cause it to miss hitching a ride with a passing mid-latitude trough to the north (in contrast to what has been persistently predicted by the more easterly model solutions such as the GFS) and have that corridor closed as the ridge builds back in and imparts a westerly to west southwesterly steering flow in about 48 to 60 hours. In the meantime, very weak steering currents should result in a slow northwesterly or north-northwesterly movement towards the aforementioned weakness. Despite this being by far the most probable scenario (80%), a more northerly to northeasterly track towards Hispaniola can’t be completely ruled out (20%). But, as noted above and over the past couple of days, that would require Melissa to become much better vertically stacked with sufficient depth. Given the continued strong and persistent westerly VWS, that seems pretty unlikely to occur. Consequently, I anticipate a track that has Melissa moving slowly northwestward towards the island of Jamaica during the next 48-60 hours followed by a sharp turn back to the west…which would keep it a good distance south of there. Beyond that point, I’m projecting Melissa to continue a general westward trajectory that takes the center further into the NW Caribbean through the upcoming weekend and into early next week. This track forecast is very similar to the latest (5 pm EDT) NHC version…albeit just a little south of their 120 hour forecast point.
If this particular track scenario comes to fruition, it’s not too hyperbolic to say that the intensity forecast has an extraordinarily high ceiling. I mean we’re talking cathedral-type levels, here, and it’s conceivable that Melissa could even approach the NATL basin records for lowest central pressure and/or maximum sustained wind speeds.
That said, it’s impossible for any of us to make any definitive declarations simply because, despite the expected pristine environmental conditions potentially awaiting Melissa beyond 72 hours, the inner-core dynamics are rather unpredictable and could very well act to limit the more extreme possibilities. Nonetheless, and as mentioned a couple days ago, a category five peak intensity appears to be the most likely (60%) outcome with this particular forecast track once Melissa gets into the NW Caribbean by the end of the weekend and early next week. In the shorter-term, however, intensification should be relatively slow to occur until the shear begins to abate in the 48-60 hour range and I’m not expecting Melissa to attain #hurricane status until after that time.
Taking all the aforementioned into account, here’s the precise center location and corresponding MSW intensity I’m forecasting for Melissa early on Monday afternoon:
1800z (10/27/2025):
16.0 N
78.9 W
MSW: 120-130 (125) kt
140 n mi SSW of Savanah La-mar, Jamaica
Forecast track shown in *yellow* on the attached map of interpolated 00z guidance solutions.


I’ll be providing a detailed analysis of the objective data in the next few days showing that the official landfall intensity for #Melissa is significantly overestimated.
Melissa was still a powerful Category 5 #hurricane when it crossed the western Jamaican coastline, but it was no longer anywhere close to a sub-900 mb storm, nor did it retain 160 kt maximum sustained winds at landfall.
It is extremely important that one analyze the available data completely devoid of any inherent bias or emotion that can interfere with complete objectivity. In other words, a desire to retain a record event or too much reliance on continuity can significantly affect a wholly objective view of these data. For me, I value the most accurate intensity estimate above all else and that is how I conduct all such analyses.
Independent Reanalysis of Hurricane Katrina’s Peak Intensity
This continues the Atlantic Category 5 #Hurricane series. Peak only. Landfall is a separate post.
Official NHC (TCR) — 28 August 2005, 1800 UTC
Winds: 150 kt (175 mph)
Pressure: 902 mb
Eye: 22 n mi at the 166 kt flight-level maximum
WxProbe Reanalysis:
MSW: 155 kt
MSLP: 902 mb
Reconnaissance
AF302 measured a 700 mb flight-level wind of 166 kt in the northeast eyewall at 1422Z. A higher wind could have occurred in the aircraft gap.
The last AF302 center fix was at 1500Z, with a pressure of 907 mb. The first NOAA3 fix was at 1755Z, which measured 902 mb. Nothing was flown in the eyewall for 175 minutes while the pressure fell 5 mb. The core was expanding across that gap: the eye was 22 n mi before it, 25 n mi at the 902 mb fix, and 28 n mi by 1923Z, and the radius of maximum wind had moved from 14–18 n mi out to 22 n mi. Given that expansion, the peak wind is treated as not missed, and the 166 kt remains the best reading.
Pressure
As mentioned above, the minimum was measured at 1755Z and again at 1923Z, 88 minutes later. The next fix was 903 mb, followed by 904 mb. The only hole is 1500Z to 1755Z. A transient value below 902 mb during that gap is possible, but not assured. Consequently, the official 902 mb is retained.
Structure
The RMW was 17 n mi from the center at the time of the 166 kt peak flight-level wind, which matched the same-mission cluster of 16–18 n mi. The mean of the nonzero R34 quadrants is 165 n mi at the peak hour. The 17 n mi inner core doesn’t erase that relatively large outer field.
Reduction Factor
RMW: 17 n mi
Pressure: 902 mb
R34: 165 n mi
The top bins (0.94, 0.95) are reserved for small-core, compact hurricanes with a central pressure <910 mb. Katrina meets the requirements on pressure, but not on size of its wind field. The 17 n mi wall is the 0.93 “width” path. The 165 n mi mean R34 is the reason the factor sits just below that, at 0.925, rather than on it.
The factor used is 0.925. 166 × 0.925 = 154 kt, which rounds to 155.
Pressure Check
CKZ, mean R34, 26.0–26.3°N, translation 10–11 kt, environmental pressure assumed 1010–1012 mb: 154–156 kt at 902 mb. In the equation, S is 0.80–0.89, so the relatively large wind field is accounted for in the solution.
Final Estimate
MSW: 155 kt (180 mph)
MSLP: 902 mb
RMW: 17 n mi
Time: 1700 UTC 28 August 2005
That is a 5 kt revision of the official wind, no revision of official pressure, and a one-hour shift of the peak from the 1800Z pressure hour to the hour assigned to the pair.
Series Comparison
Wilma and the 1935 Labor Day Hurricane remain 170 kt. Melissa is 165 kt. Katrina ties Andrew and Camille at 155 kt, with a larger RMW and a much larger R34 than either.


Looking Back on Hurricane Isaias — One Week Later
Hurricane #Isaias peaked as a Category 3 major hurricane (105 kt/120 mph, 959 mb) on October 9 as it was closing in on the Florida Panhandle. It weakened thereafter due to increasing wind shear and dry air entrainment. The center made landfall near Destin, Florida, at about 8:30 p.m. CDT on October 9 as a Category 2 (90 kt/105 mph, 971 mb).
The leading northern edge of the eyewall reached the Okaloosa Island/Fort Walton Beach area while the storm was still a legitimate Category 3 (100 kt); it then weakened by roughly 10 kt over the final 2.5 hours before the center actually crossed the coast.
On a personal note, I was positioned on the narrow and exposed road on Okaloosa Island between Fort Walton Beach and Destin, where wind gusts exceeded 100 mph as the western and southwestern parts of the eyewall moved through. This constituted the 46th U.S. mainland #hurricane eyewall intercept and the 19th major (as it was still a Cat 3 when the aforementioned northern edge moved overhead).
The storm produced an unusually broad and asymmetric wind footprint for its official Category 2 landfall intensity. Recorded gusts of 100+ mph occurred from the Pensacola City Hall area to Freeport (~55 nmi along the coast), including within the eyewall and extending well outside it in the western quadrant. In addition, hurricane-force gusts (74+ mph) spanned from Orange Beach, Alabama, to Beacon Hill just east of Mexico Beach (~120 nmi). The peak measured gusts reached 116–118 mph near Oriole Beach and Jay. A sting-jet-like feature on the western edge of the precipitation shield (during the onset of extratropical transition) helped drive the unusually strong western-quadrant winds. These winds caused widespread tree and power-line damage, roof losses on beachfront hotels and other structures, and collapsed gas-station canopies.
More than 900,000 customers lost power across Florida, Alabama, and Georgia (peak reports were around 910,000–911,000). Worst of all, at least nine fatalities were confirmed (six in Florida, two in Alabama, and one in South Carolina), mostly from falling trees and related incidents. Storm-surge inundation of roughly 5.6 ft was observed at Panama City Beach. A Flash Flood Emergency was issued for southern Okaloosa County due to torrential rainfall, with widespread 5–8 inch totals and localized amounts exceeding 12 (including over 11 inches near Mary Esther and Fort Walton Beach), producing major freshwater flooding that caused significant damage to homes and businesses in that area. Preliminary estimates of losses surpass $2 billion.
For residents of the western Florida Panhandle, Isaias is a storm that will be talked about for generations to come.
I’m sorry for the delay, but I finally completed the arduous editing process of the video I captured during #Hurricane #Isaias.
Here are the highlights of what I documented from Fort Walton Beach, Okaloosa Island, and Destin, Florida.
As you will see, it appeared that the winds were stronger when the western and southwestern parts of the eyewall moved over the Island.
Jeff here is arguing that the recent backloaded #hurricane seasons (quiet peaks, late activity, and more Florida Gulf hits) are mainly a climate-change stability signal from warmer summers.
The same period is better explained by the MJO. The predominant background state has been a warm AMO since 1995, with ENSO as the main seasonal modulator. On top of that, the MJO has been the primary subseasonal control.
In 2024, 2025, and this season, the MJO was unfavorable or weak through most of the peak (until after 9/16), then shifted more favorable later — exactly when activity increased. The 2023 season had the opposite alignment and produced a hyperactive peak instead.
Year-to-year timing differences track the MJO, *not* a uniform stability suppression. The MJO has been the dominant reason for the quiet peaks and late bursts in these years.

Boosting Andrew’s post and adding a talked about “backloaded season” theory to this. 🌀 Florida Can’t Get A Break! 🌀
11 Hurricanes in 11 Years! Here’s the crazy part… 10 of those hit the Gulf Coast! Coincidence? Cycle? Maybe… we’ve seen that before. But there may be a more scientific reason. Hear me out…
Many weather and climate scientists think it may be due to an increase in “backloaded seasons”. That means the first half of seasons are less active now-a-days, and the 2nd half are more busy.
So, since the Gulf is favored in fall, and tracks tend to go Northeastward due to autumn steering patterns, the storms are more likely to crash into Florida’s #Gulf Coast.
If you are interested, let’s dig a little deeper. During July/ August storms tend to move from east to west due to easterly steering winds in summer. So IF a storm forms in mid-summer it’s more likely to hit the #Florida East Coast. However it’s been very quiet lately in July and August lately. To the contrary, Sept and October have been active. Those storms are more likely to form in the W Caribbean and Gulf and hitch a ride on the Autumn Jet Stream, hitting the eastern side of the Gulf.
So… why are seasons backloaded? Probably warmer summers. It’s a bit complex, but over the longer term the mid-high level atmosphere is warming faster than the low-levels during summer. If it’s warmer aloft, there’s less vertical contrast, then the air below tends not to rise. Less rising air = less storms. It’s called stability. Thus quiet summers.
But then when the upper atmosphere starts to cool in fall, the hotter water and cooler air aloft has more contrast. Then the action begins… warm air rises and storms form. Since the favored area in fall is the Gulf, and the favored steering is towards the Northeast, it’s a recipe for more Gulf Coast #Hurricane hits.
If this theory is right - since warming will continue - it seems likely “backloaded” seasons may play a more prominent role in future #hurricane seasons and the target may increasingly be the Gulf Coast. Just a theory for now. But worth monitoring.

I’m sorry for the delay, but I finally completed the arduous editing process of the video I captured during #Hurricane #Isaias.
Here are the highlights of what I documented from Fort Walton Beach, Okaloosa Island, and Destin, Florida.
As you will see, it appeared that the winds were stronger when the western and southwestern parts of the eyewall moved over the Island.
As some may know, I always devote a minimum of 4-6 hours helping the survivors and affected community in the direct aftermath of every #hurricane. That commitment began with Katrina in 2005 and will continue for as long as I chase and document them.
The main damage left in the wake of #Isaias around Fort Walton Beach has been large portions of roofs torn off beachfront hotels and freshwater intrusion of some homes and businesses from severe flash flooding.
At this point, I am beginning the long drive home and will edit video as I stop along the way.


Hurricane #Isaias delivered a very impressive wind footprint —especially for a Category 2 landfall — producing *recorded* gusts of 100+ mph from Pensacola City Hall to Freeport (~55 n mi along the coast), including within the eyewall itself and extending well outside of it in the western quadrant. Hurricane-force gusts (74+ mph) spanned from Orange Beach, AL to Beacon Hill — located just east of Mexico Beach (~120 nmi).
This broad and asymmetric wind field featured unusually strong winds in the western quadrant, driven by a sting-jet-like feature on the western edge of the precipitation shield as the storm began extratropical transition. As seen in the attached video, my intercept location endured the peak winds in the western and southwestern parts of the eyewall, with wind gusts well over 100 mph as well.
I’m sorry for the delay, but I finally completed the arduous editing process of the video I captured during #Hurricane #Isaias.
Here are the highlights of what I documented from Fort Walton Beach, Okaloosa Island, and Destin, Florida.
As you will see, it appeared that the winds were stronger when the western and southwestern parts of the eyewall moved over the Island.
As some may know, I always devote a minimum of 4-6 hours helping the survivors and affected community in the direct aftermath of every #hurricane. That commitment began with Katrina in 2005 and will continue for as long as I chase and document them.
The main damage left in the wake of #Isaias around Fort Walton Beach has been large portions of roofs torn off beachfront hotels and freshwater intrusion of some homes and businesses from severe flash flooding.
At this point, I am beginning the long drive home and will edit video as I stop along the way.
I will have a video compilation posted by later this afternoon or evening.
I documented the strongest winds on Okalossa Island, with fetch coming directly off the sound. That is the location where 116 mph wind gusts were measured.
As expected, #Isaias weakened on approach as the dry air was advected into the inner core. Even so, it was able to maintain most of its peak intensity (105 kt down to 90 kt), by remaining on the aforementioned “fast branch.”
Before Isaias — There was Michael
Today marks the eighth anniversary of the last Category 5 #hurricane to strike the U.S. mainland.
Hurricane #Michael claimed more than 50 lives and forever changed countless more. Sadly, many lost everything they owned—including homes their families had maintained for generations. The hardest-hit town of Mexico Beach was nearly wiped off the map. Although it has slowly recovered, its trademark “forgotten coast” character was largely erased.
The combination of its extreme intensity at landfall and relatively fast forward movement allowed it to devastate communities hundreds of miles inland. Total damage exceeded $25 billion.
I was on Mexico Beach that fateful afternoon documenting the landfall firsthand. I recorded the absolute peak—gusts over 200 mph and 14–15’ of storm surge—as the eyewall tore through and destroyed the town.
Here’s what I saw. The brunt of the winds runs roughly from the 58:00 mark to about 1:18:00 (note that the footage from 1:04:00 to 1:07:00 is from much earlier in the eyewall, preceding the peak):
youtu.be/wiL3QKraaTY
