

🇩🇪 Price action & market structure Equities, Bitcoin and crypto I show you which asset is currently undervalued. Join my FREE Newsletter 👇 NFA
Joined August 2025
- Tweets21.6K
- Following462
- Followers2.5K
- Likes34.1K



Pinned Tweet
Good morning, Investors.
$NVDA is down about 4% overnight.
The reason: Nvidia is investigating whether Jensen Huang was targeted by Chinese intelligence through a close personal contact.
The stock was already trading 24% below its all time high. Now this headline hits on top.
But let's separate the noise from the business.
Last quarter Nvidia did $96.2B in revenue. Up 106% year over year.
Data center alone brought in $89B.
Gross margin sits at 75%.
And they returned $26B to shareholders in a single quarter.
None of that changed over the weekend.
This is headline risk. Not a business problem. Keep in mind that overnight trading is thin. The real reaction comes at the open.
Tomorrow we get the US CPI data.
On November 17 Nvidia reports. Guidance is $108B → the numbers get the final word.
Eyes on the market.

Is the memory cycle over?
$MU trades at 705.12, down 3.82% today.
Yesterday closed below 738.57.
That low is now broken.
Price also slipped below the 200 SMA.
Small trend is down.
The drop into 738.57 played out.
The break below confirms it.
Higher trend is under pressure.
The last support of the uptrend gave way.
That shifts the bias to bearish continuation.
Main scenario is bearish.
As long as price stays below 738.57, lower levels are in play.
Alternative: a daily close back above 738.57.
That would mark the break as a fakeout.
Then 1,035.63 comes back into play.
Bullish confirmation only above the pivots at 1,106.51 and 1,254.18.
The earlier bullish scenarios toward the highs are invalidated.

5
7
298
I’ve been watching $RKLB for a long time. Yesterday’s earnings were a mixed bag.
EPS came in at $-0.12. Expected was $-0.07.
The net loss grew to $79.7M.
And Neutron got delayed again. First launch now no earlier than 2027.
But look under the hood.
Revenue hit $267.8M. Up 73% year over year.
The backlog reached a record $3.57B.
And Rocket Lab sits on about $4.4B in cash.
This is not a company running out of time. It’s a company that has time.
The chart tells a different story for now.
Rocket Lab retested the old support around $60. That zone is now resistance.
Overnight trading shows a clear rejection at $54.45.
My main scenario is bearish. The zone down to $43.82 comes into play.
From there it’s a 50/50. Holding $43.82 opens the way back up. Losing it opens the zone down to $37.51.
The stock also trades far below the 200 SMA at $78.72.
Neutron is the next big catalyst.
When it flies, Rocket Lab competes directly with SpaceX in medium lift.
Follow for more.

Good morning, Investors.
$AMD is still more than 20% below its all time high.
But look at what they reported last week:
Revenue $13.4B. Up 45% year over year.
Data center $8.5B. Up 97%.
EPS $2.09. Up 74%.
The chart says it all. Quarterly revenue went from $4.83B to a record $13.38B. That’s +177% in five years.
And the guidance for Q4 is $17B → another record quarter.
The business is accelerating. The stock is still at a discount.
Yesterday it bounced 11.6% right off the 200 SMA. Smart money noticed.
Today we get the US CPI data.
A cooling print could be the fuel this market needs.
Let’s get it.

$IONQ is pushing after earnings.
Up 10.6% today. Trading at $36.07.
Price swept below the green line at $25.87 and closed back above it.
The bigger trend is intact as long as $25.87 holds.
Buyers defended it again.
The smaller trend is still down. Lower highs since $47.61.
Today’s bounce pushed back above $34.74.
My main scenario is bullish.
The zone up to the 200 SMA around $41.95 is now in play.
Pullbacks along the way are normal. Price can fall back to $25.87 without breaking the structure.
A reclaim of the red line at $47.61 flips the smaller trend. Then the zone above opens up.

THIS IS THE #1 MARKET RULE RIGHT NOW:
THE BIGGEST RALLIES FOLLOW THE BIGGEST SELLOFFS.
Here are the 7 best stocks you can buy right now 👇
1. $NVDA
27% below its all time high. Down 4.9% today on the Jensen Huang headline.
The bigger trend weakened. Price lost the 200 SMA around $204.62.
The smaller trend is down. $207.40 and $190.07 both broke.
Now testing $171.02.
Main scenario: it holds. Then the zone back to the 200 SMA comes into play.
Alternative: a close below opens the way to $164.26.

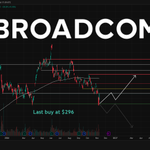
This week decides which path $AVGO takes.
Friday closed at $293.69. Right at the green line at $294.98.
Premarket is back above it at $302.39.
The bold arrow played out. The break below $322.22 sent price straight into support.
The grey arrow is invalidated.
The stock trades far below the 200 SMA at around $367.
The bigger trend is in a correction. Lower highs at $434.20 and $381.19.
This is a 50/50 setup. Premarket leans to the upside.
Holding $294.98 keeps the floor intact. Then the zone up to the red line at $381.19 comes into play.
A daily close below $294.98 opens the zone further down.
On the 4h chart, a reclaim of $351.97 would be the first sign the trend is turning positive.
To make it sustainable, Broadcom needs to reclaim $381.19. That opens more upside.
My last buy was at $296.

$HIMS defended the August low.
Price closed at $26.00. Up 8% on the day.
The wick dipped below the green line at $24.27, but the close came back above it.
The stock is trading just below the 200 SMA.
As long as it can’t reclaim it, the bigger trend stays bearish.
The smaller trend looks different.
Higher lows since February. $24.27 is the latest one.
Price can fall back to $24.27 without breaking that structure.
My main scenario: $24.27 holds and the higher lows stay intact. Then the zone up to the red line at $38.40 comes into play.
Levels in between: $26.83 and the yellow line at $31.05.
The alternative: a daily close below $24.27 breaks the structure. Then the zone down to $18.52 opens up, with $21.62 in between.
The earnings reaction will decide.
Earnings drop today after the bell.

$BTC is about to test the 200 SMA at $73,100.
A daily close below this level would be a bad sign.

If $BTC drops below $73,000, panic selling could follow.
Short term holders are mostly back in loss.
A break opens the way for a small sell cascade.
But Bitcoin is correlating with the Nasdaq again.
If $QQQ recovers, Bitcoin recovers.
To break the short term downtrend, it needs to reclaim $80,000 quickly.
Above $84,000, new local highs are back on the table.
I’m watching the 200 SMA around $73,100.
A retest of this line is typical after a bottom has formed.
On Tuesday we get the US CPI data.
Economists surveyed by Bloomberg expect +0.3% month over month, core +0.2%.
That would mean inflation is cooling. Good news for our portfolios.
This is where the next move gets decided.
Follow for more.

6
13
427
If $BTC drops below $73,000, panic selling could follow.
Short term holders are mostly back in loss.
A break opens the way for a small sell cascade.
But Bitcoin is correlating with the Nasdaq again.
If $QQQ recovers, Bitcoin recovers.
To break the short term downtrend, it needs to reclaim $80,000 quickly.
Above $84,000, new local highs are back on the table.
I’m watching the 200 SMA around $73,100.
A retest of this line is typical after a bottom has formed.
On Tuesday we get the US CPI data.
Economists surveyed by Bloomberg expect +0.3% month over month, core +0.2%.
That would mean inflation is cooling. Good news for our portfolios.
This is where the next move gets decided.
Follow for more.
Good morning, Investors.
$NVDA is trading 24% below its all time high.
Here is what the last quarter looked like:
Revenue $96.2B, up 106% YoY.
Data center $89.0B, up 117% YoY.
Gross margin 75%.
$26B returned to shareholders in a single quarter.
The business keeps growing at triple digits. The stock is not following.
On November 17 Nvidia reports Q3.
Guidance is $108B in revenue → another record quarter if they deliver.
The market is pricing fear. The numbers are not.
Enjoy your Sunday.

Good morning, Investors.
This week the market sold everything connected to AI. $VST dropped over 6% in a single day.
Then Vistra reported. Adjusted EBITDA jumped around 50% to $2.38 billion. Guidance for 2026 got raised at the midpoint. And for 2027, Vistra expects up to $8.5 billion.
On top of that: a new 20 year power deal for a data center in Texas. And another $1.5 billion in share buybacks.
The market sold the fear. The business delivered the numbers.
Monday's open → let's see who was right.
Stay bullish.

The jobs report is out. And it's stronger than expected
165K jobs added in October. Expected: 59K. Unemployment fell to 4.1%. August and September were revised up by a combined 84K.
No sign of a slowdown here. The economy is holding up while chips sell off.
The one catch: with inflation still elevated, a hot labor market gives the Fed more room to hike. That's the next thing to watch.
Now let's see if $QQQ can reclaim $660.
Why is the market selling off again today?
The whole market is red. And the Nasdaq is now in correction territory.
$QQQ is down 5.5% at $654. It lost the 200 day moving average at around $681 and broke below the $660 support. That’s exactly the level I flagged: losing $660 means a bigger correction.
The bullish path I drew is invalidated. Marked it grey. The bold arrow played out. And as long as $QQQ stays below $660, a bigger correction is now my main scenario. Only a quick reclaim of $660 would make this a fakeout.
So what’s driving it?
Chips are getting crushed. The semiconductor index dropped more than 7%. $QCOM fell around 9% after weak smartphone chip sales. $NVDA, $AMD, $INTC and $MRVL are all weighing on the index.
The whole AI infrastructure trade is under pressure. After the midterms, investors expect more scrutiny on the aggressive AI buildout and growing pushback against new data centers. UBS warns that around 30% of the data center capacity planned for 2028 is now at risk.
On top of that, inflation stays elevated and traders expect a Fed rate hike next month.
I don’t think this selloff is over yet. Lower prices in the short term are still on the table.
I’m not panicking. I’m preparing. My next limit orders for $AVGO . $GOOG is getting interesting too. And of course I keep buying $BTC at lower prices.
Tomorrow’s jobs report will show whether we get a bounce or whether the downtrend continues for longer.

“The time of maximum pessimism is the best time to buy.” Sir John Templeton
Here are 5 of the best stocks to buy right now:
1/ $AVGO
Broadcom is down 10.6% this week and fell right into the $294.98 support. That’s exactly where I bought my last tranche at $296.
The bullish path I drew before is invalidated. Marked it grey. The stock lost the $336.09 support and the bold arrow played out.
In premarket it’s already bouncing back to $306.
From here it’s a 50/50 setup.
Holding $294.98 keeps the bigger uptrend intact. The stock can fall there without breaking it. Reclaiming $336.09 would bring $381.19 back into play.
Losing $294.98 would open the door for a deeper correction.
The 200 week moving average sits far below at around $213.


2/ $NVDA
Nvidia dropped 9.3% yesterday and closed at $181.60. It lost the $207.40 support and the 200 day moving average at around $205. The bold arrow played out.
The bullish path I drew before is invalidated. Marked it grey.
Yesterday’s close also came in below the $190.07 support. But in premarket the stock is already back at $189.
From here it’s a 50/50 setup. Today’s close decides a lot.
Reclaiming $190.07 keeps the bigger uptrend intact. Then $213.42 is the next level that comes into play.
If Nvidia stays below $190.07, the zone down to $171.02 is in play. The bigger uptrend stays intact as long as $164.26 holds. The stock can fall there without breaking it.

1
5
257
Good morning, Investors.
$IONQ just delivered one of the strongest quarters of this earnings season.
Revenue came in at $173.8 million vs $141.2 million expected. That’s up 336% year over year. And more than double the previous quarter.
On EPS, analysts expected a loss of $0.79. IonQ reported $1.35.
And the stock? Still trading around $26. Far below its highs, dragged down by the AI selloff this week.
The market is selling everything with AI in its name. The numbers tell a different story.
Today brings the jobs report → the next test for this market.
Let’s get it.

THE MARKET WILL PUMP AGAIN SOON. BOOKMARK THIS.
Everyone is panic selling like the AI boom just ended. But there’s no reason for a massive crash. One AI company alone just disclosed around $895 billion in compute commitments. The order books are full.
Bought $AVGO today.
This is how the dip buyers look in a few months:👇
The market is selling AI infrastructure today. Anthropic just showed why that might be a mistake.
Investors fear the AI buildout is slowing down. Chips and data center stocks are getting crushed.
But look at Anthropic's latest IPO filing. Around $895 billion in commitments for compute and data centers.
The biggest one goes to $AVGO. $161 billion.
Then $GOOG with $121 billion. Up to $120 billion to $SPCX. And $110 billion to $AMZN.
Around $70 billion of that comes due in the next 12 months.
That's one AI company. Not the whole industry.
The market is pricing in a slowdown. The order books say otherwise.
My limit order for $AVGO at $300 just got filled.
Have a good day everyone.

Anthropic has now disclosed a record $895 billion in future AI infrastructure spending commitments.
This includes both purchase commitments and leases for computing power and related infrastructure.
$448 billion, or 50%, is expected to be incurred by the end of 2030, with ~$70 billion due over the next 12 months.
The biggest commitments are to Broadcom, $AVGO, at $161 billion, followed by Google at $121 billion, with up to $150 billion in additional estimated spending on Google's AI chips.
Anthropic has also committed up to $121 billion to SpaceX, $SPCX, and at least $110 billion to Amazon, $AMZN.
For perspective, among Big Tech companies, only Alphabet, $GOOGL, has larger commitments, at $1.06 trillion, while Meta, $META, follows with $866 billion.
The scale of Anthropic's spending obligations is unprecedented.

Why is the market selling off again today?
The whole market is red. And the Nasdaq is now in correction territory.
$QQQ is down 5.5% at $654. It lost the 200 day moving average at around $681 and broke below the $660 support. That’s exactly the level I flagged: losing $660 means a bigger correction.
The bullish path I drew is invalidated. Marked it grey. The bold arrow played out. And as long as $QQQ stays below $660, a bigger correction is now my main scenario. Only a quick reclaim of $660 would make this a fakeout.
So what’s driving it?
Chips are getting crushed. The semiconductor index dropped more than 7%. $QCOM fell around 9% after weak smartphone chip sales. $NVDA, $AMD, $INTC and $MRVL are all weighing on the index.
The whole AI infrastructure trade is under pressure. After the midterms, investors expect more scrutiny on the aggressive AI buildout and growing pushback against new data centers. UBS warns that around 30% of the data center capacity planned for 2028 is now at risk.
On top of that, inflation stays elevated and traders expect a Fed rate hike next month.
I don’t think this selloff is over yet. Lower prices in the short term are still on the table.
I’m not panicking. I’m preparing. My next limit orders for $AVGO . $GOOG is getting interesting too. And of course I keep buying $BTC at lower prices.
Tomorrow’s jobs report will show whether we get a bounce or whether the downtrend continues for longer.