
economics, #rstats, https://teapawt.net/t.co/CII5gMcNXw
Germany
Joined January 2015
- Tweets690
- Following3.1K
- Followers316
- Likes1.6K

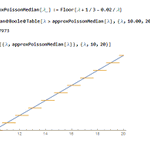


Fun question to solve with #mathematica.


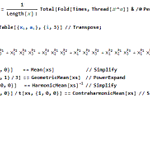
My solution using #Mathematica @WolframResearch .

This Post is from an account that no longer exists. Learn more
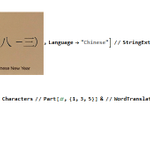
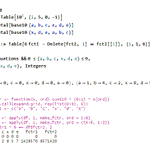
Fun way to solve this problem in #Mathematica using built-in optical character recognition and translation.


Today's #dailymaths problem from the Mathematics 2020 calendar in pic. Solution will post tomorrow. Daily problems with previous day's solution are tweeted ~6am Eastern. Solutions by me and/or @MathsTim unless otherwise stated. Guest solution posts welcome--DM if interested.

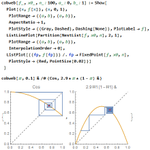
Cobweb plots in #Mathematica.


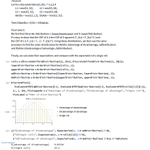
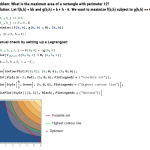
Simple optimization problem today:
#Mathematica #WolfLang

Today's #dailymaths problem from the Mathematics 2020 calendar in pic. Solution will post tomorrow. Daily problems with previous day's solution are tweeted ~6am Eastern.


Today's #dailymaths problem from the Mathematics 2020 calendar in pic. Solution will post tomorrow. Daily problems with previous day's solution are tweeted ~6am Eastern. Today’s is perhaps trickier than it seems, so good luck!

Recurse all the things! My solution to Day 6 of #AdventOfCode using #rstats:
github.com/expersso/advent_o…


Yes, any other #rstats aficionados doing #AdventOfCode this year?
(I’m working on to catch up here: github.com/rasmusab/r-advent…


New blog post, in which I solve a neat problem posed by @ryxcommar using some lesser-known base #rstats functions: eric.netlify.com/2019/08/20/…


Eric retweeted

In grad seminar we've been talking recently about getting data from the web. Here are my notes and code-through for using rvest to scrape tables and automate file downloads in #rstats, with semi-random shoutouts to @juliasilge, @expersso, and @VincentAB:
cmcr-class.rbind.io/blog/201…
New #rstats blog post: XKCD and the normal distribution eric.netlify.com/2019/03/04/…
Inspired by @tslumley teapawt.net/xkcdComic/status/11014…


Or analytically:
c("Team A wins" = dbinom(0, 20, 0.055),
"Draw" = dbinom(1, 20, 0.055),
"Team B wins" = 1 - pbinom(1, 20, 0.055))
Team A wins Draw Team B wins
0.32 0.38 0.30
#rstats

x <- replicate(10000, sum(sample(0:1, 20, TRUE, c(0.945, 0.055))))
table(ifelse(x == 0, "Team A win", ifelse(x == 1, "Draw", "Team B win"))) / 100
Draw Team A win Team B win
37.52 32.18 30.30
#rstats
x <- replicate(10000, sum(sample(0:1, 20, TRUE, c(0.945, 0.055))))
table(ifelse(x == 0, "Team A win", ifelse(x == 1, "Draw", "Team B win"))) / 100
Draw Team A win Team B win
37.52 32.18 30.30
#rstats
This quoted post is unavailable.