

data + crypto = magic internet money
Joined February 2018
- Tweets175
- Following56
- Followers62
- Likes144






There’s too many accounts like these and they won’t stop.
People who know nothing too are buying their courses and they won’t stop posting because of that.
This was me a while back. I tested everything, even the concepts themselves, and found zero predictive power. You can’t find an edge by combining things that don’t have one in the first place. You’ll only overfit.
Let me help you quit:
xitter.cf/hyperfitted/status/210…

Day trading doesn't work. At least not the version that gets pushed on social media.
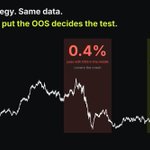
Look at my banner. Thousands of traders flipping coins with zero edge. After a year, take the top 1%. They look like they've cracked the market, so they start posting, selling courses, running mentorships. In reality they just got lucky. The other 99% never post anything.
The worst part is the main message that gets pushed: it takes years and years to finally crack it. Just keep believing. So you keep buying evals, keep trying, keep paying subscriptions. That sentence isn't there to help you. It's there to keep you paying.
And it gets you hooked. It's an addiction. A random win now and then feels like proof you know what you're doing, every loss makes you think you did something wrong, and the next setup always looks like the one. Once you're in, getting out is almost impossible.
And the concepts themselves are BS. With ICT you can open any chart and explain every move after the fact. Liquidity got swept, CISD/BOS, price ran to the draw. In hindsight it all looks obvious.
Live, it's the same trap. When you win a clean trade, it feels like the concepts worked perfectly. When you lose, you always find something to blame: you missed this, that wasn't aligned, the HTF wasn't confirmed...
"The concept is never the problem. It's always you."
So I tested it. LRLR with an HTF DOL sweep, LTF sweep, CISD/BOS/IFVG entry. Perfected the rules so it would take the exact trades I would take live. Some trades worked perfectly. Some went straight to SL. Overall it was a coin flip with zero predictive power.
The clean ones are the screenshots you see. The ones that failed completely never get posted. Same in every mentorship: the top students post their wins and payouts, the losing ones stay quiet (my banner again). And with all that subscription money, a mentor can buy enough evals that one of them is basically guaranteed to pay out.
And if you keep losing money, they tell you trading is 90% psychology. It's you vs you. It's not. It's 100% strategy, and it's not you vs you. On the other side are billion-dollar institutions doing everything they can to keep price as precise and efficient as possible. No amount of discipline fixes a strategy with no edge.
I'm an ex day trader. I got a few payouts myself, and I can't honestly say they were more than luck. Since then I've tested many, many other concepts and features. Not one of them gave me a reliable edge.
Test any of it over thousands of trades and you'll see the same thing. Zero predictive power.
You're not going to beat one of the most efficient, liquid markets on earth by drawing boxes and lines on a chart.
So what does work?
Trading less liquid, less efficient markets. Finding an edge there is astronomically easier. Or taking a systematic approach to prop firms and using their payoff structure to make a profit.
Both come from testing and math.
But don't get me wrong. Sponsorships, mentorship money, YouTube ad revenue, referral links for evals... those all pay very well.
Combine that with young people who believe they're going to change their life, and a system built to keep them hooked and paying for years, and you've got the perfect business...
If a strategy only passes when the test is easy, it hasn’t passed.
Most of you split your data the same way. First two thirds in-sample (IS), last third out-of-sample (OOS).
Then you check the IC, fwd return deciles, the Sharpe...
If the OOS numbers hold up, the strategy is "validated."
Here's how that goes wrong.
Hardly anyone checks what the market was actually doing in each part.
Say the first two thirds holds the crash, the chop and the slow bleed. The last third is one clean bull run.
You optimize on the hard part. Every parameter tweak that dodges a bad stretch pushes the IS Sharpe up. By the end, the model is great at surviving that one crash and that one chop.
Then it reaches the OOS. A bull run, where almost anything that's long makes money. It passes.
But the test never asked the real question: does this work in a hard market it wasn't tuned on? Every hard market went into the tuning. Only the easy one was left for the grade.
Before you look at a single metric, look at the chart:
- What regimes are in your IS?
- What regimes are in your OOS?
If your OOS is one easy market, the test was decided before you ran it.
Put it over a stretch that actually hurts, and let the IS take both ends.
An out-of-sample test is only as hard as the market you put in it.

Pisses me off how poeple think they manipulate the market to stop out your order on a sim account...
Market makers just keep buy and sell orders near the current price at all times and profit off the spread. They are on the other side of the trade when you use a market order.
I'd be down to backtest your strategy on years of data systematically. If you really think it has an edge, let me prove it. Feel free to dm if you're down.
I'm giving my last shot at daytrading strategies before I let them go forever
1. OOS regime vs IS regime
2. params: stable plateau on the heatmap or a lone peak?
3. how many variants were tried
4. IC + fwd returns by signal decile
5. any nonlinear transform: economic reason upfront, or fit to the decile chart?
6. results net of costs
Just make sure you clasify "actionable" correctly, because out of 200 at least few can pass the OOS just by chance
It looks much worse on hyperliquid haha. I've recently too had a drawdown on my xs neutral portfolio but not as bad as this one...

Most of you split your data the same way. First two thirds in-sample (IS), last third out-of-sample (OOS).
Then you check the IC, fwd return deciles, the Sharpe...
If the OOS numbers hold up, the strategy is "validated."
Here's how that goes wrong.
Hardly anyone checks what the market was actually doing in each part.
Say the first two thirds holds the crash, the chop and the slow bleed. The last third is one clean bull run.
You optimize on the hard part. Every parameter tweak that dodges a bad stretch pushes the IS Sharpe up. By the end, the model is great at surviving that one crash and that one chop.
Then it reaches the OOS. A bull run, where almost anything that's long makes money. It passes.
But the test never asked the real question: does this work in a hard market it wasn't tuned on? Every hard market went into the tuning. Only the easy one was left for the grade.
Before you look at a single metric, look at the chart:
- What regimes are in your IS?
- What regimes are in your OOS?
If your OOS is one easy market, the test was decided before you ran it.
Put it over a stretch that actually hurts, and let the IS take both ends.
An out-of-sample test is only as hard as the market you put in it.
Same guys that grid searches every parameter, posts the best backtest, and sells it as a strategy to promote their algo trading school...
The only useful thing you can use it for, is to find the pass rate of evals if you're looking to trade Propr or some futures prop firms
This is the core of momentum. Rising prices pull in more buyers, trends persist longer than they “should,” and the strategy harvests that.
The occasional violent reversal is the risk premium you’re being paid to carry.