

"Data driven stories and analysis on politics, culture, technology, and world events." | AI & Data Science | Research + Mathematician - Neurodivergent (Autism)
United States
Joined January 2022
- Tweets12.1K
- Following1.8K
- Followers3.4K
- Likes40.6K


Pinned Tweet
🚨What jobs will AI replace?
Who will be affected the most?
I created a basic model based on the WEF 2025 prediction model as to where the job market is headed.
The report predicts that 92M jobs will be displaced by 2030.
However…
They also predict that these structural disruptions will create 170M new roles.
On the frontline of that are going to be technology roles that will likely require technical skill.
I’m still working on a variance model to distinguish these roles, the skills, and the education that will be required.
I’ll create a separate model for that.
The larger categories of job loss will predominantly be in administrative, customer service, and office support.
Advanced Tech & AI is the largest job growth market. This will include prompt engineers, AI Quality Controllers, Fintech Engineers, and Digital transformation specialists.
The question is…
although more jobs will be created than lost, as of now it appears that the low income and lower class will suffer the most.
However, the care economy such as educators and teachers will likely boom as the next generations will have to be upskilled.
More to come on this data story.
Model and visualization by Samantha Glover..


Samantha Glover retweeted
Mathematics can predict or help in deciding issues related to life, business, politics and economics.

𝐌𝐚𝐭𝐡 & 𝐒𝐭𝐚𝐭𝐢𝐬𝐭𝐢𝐜𝐬 𝟏𝟎𝟏
Political Example of Pearson Correlation Coefficient (r)
This formula is used to measure the strength and direction of the relationship between two variables.
Suppose as an example, we want to know if there's a relationship between campaign spending and votes received.
Variable 1: Campaign spending
Variable 2: Percentage of votes received
Hypothetically, after analyzing data from multiple candidates, we find that
r = +0.82
This would suggested a strong positive correlation between campaign spending and votes received.
Candidates who spend more money tend to receive more votes.
The relationship is strong because 0.82 is close to +1.
This is a hypothetical as an example.


Samantha Glover retweeted

I would bet virtually everyone posting negative comments about Nathalia could not remain as composed as she was during this tragedy. Please show some grace and stop trashing her and all she accomplished in a life that was too short.
Samantha Glover retweeted

She was locked in. Her last sentence was: “Fuck, we’re out of time.” She was in the game until impact. It doesn’t get more professional than that.
What a tragic loss.
Samantha Glover retweeted

If today didn’t go as planned, congratulations. 🥳
You now have something in common with every person who’s ever done anything interesting. Keep it up....it will pay off.


Samantha Glover retweeted

Some Black Americans look almost entirely African, others look biracial, white passing, Native American, or Hispanic. That’s because African ancestry ranges from about 7% to 95%. Aside from groups like the Cape Coloureds and Rehoboth Basters of Namibia, Black Americans appear more diverse in appearance than Sub-Saharan and North Africa.


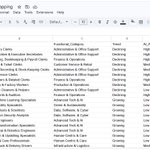
AI Job Displacement – Data Set Explanation
Below is the data mapping of the data set I’ve been working with from the WEF 2025 dataset.
Occupation ID is the identifier I use to aggregate or disaggregate certain data points.
The job title identifies the actual occupation being analyzed, while the functional category provides a general classification under which the job title falls.
The trend column tells us whether a job role is growing or declining.
The AI automation field indicates whether the level of displacement due to AI automation is high or low.
This is just the data mapping. I’ll share other data sets related to the WEF model and explain how they work.
More to come on this data story…

Samantha Glover retweeted

I love Julianne Moore and though I haven't seen THE DEBUT, I am sure she is great in it as she always is.
Having said that, I would love to see Olivia Wilde be a serious Oscar contender not just for the nomination but also for the win in Best Actress.
BRILLIANT work!

Samantha Glover retweeted

This app has actually become quite scary.. absolutely no compassion or empathy at all.
Samantha Glover retweeted

A veteran and a helicopter pilot with 7000 hours in Himalayas. Capt Nathalia Gadelha is a Hero , I wish i would be as composed if ever facing those odds...
Samantha Glover retweeted
𝐌𝐚𝐭𝐡 & 𝐒𝐭𝐚𝐭𝐢𝐬𝐭𝐢𝐜𝐬 𝟏𝟎𝟏: 𝐀𝐛𝐬𝐨𝐥𝐮𝐭𝐞 𝐂𝐡𝐚𝐧𝐠𝐞
A common first step in diagnostic analytics is quantifying how much a metric changed before investigating the factors that contributed to that change...
In order to implement a deep dive in diagnostic analytics, one of the foundational and simple formulas to use is Absolute Change.
In other words, measuring the difference between two values to quantify the size of that change.
If we want to understand WHY something has changed, we can first quantify the SIZE of the change before investigating the factors that contributed to it.
For example, let's say your X profile had 10,000 impressions in September, but in October it dipped to 5,000 impressions.
You would measure the difference between them.
Old Value = 10,000
New Value = 5,000
Absolute Change = 5,000 impressions
Percentage Decrease = 50%
From there, you can begin asking certain questions.
Is the change in impressions connected to specific types of content?
Is it only certain types of content that have lower versus higher impressions?
What content groups and categories are driving the change?
You can also connect impressions to engagement. As high impressions alone are not a measurement of the effectiveness of content.
You can then build other calculations to estimate how much your content may grow by changing your content strategy.
Absolute Change helps answer HOW much did it change?
Diagnostic analytics helps answer, WHY did it change?
What are your thoughts?.


Samantha Glover retweeted

I have flown the Queen of the Sky! ✈️
It doesn’t feel real. If you said, 5 years ago, I would be flying a 747, I wouldn’t have believed you. I barely believe it now!


