These pretzels are making me thirsty
Joined January 2009
- Tweets3.9K
- Following985
- Followers209
- Likes5.9K


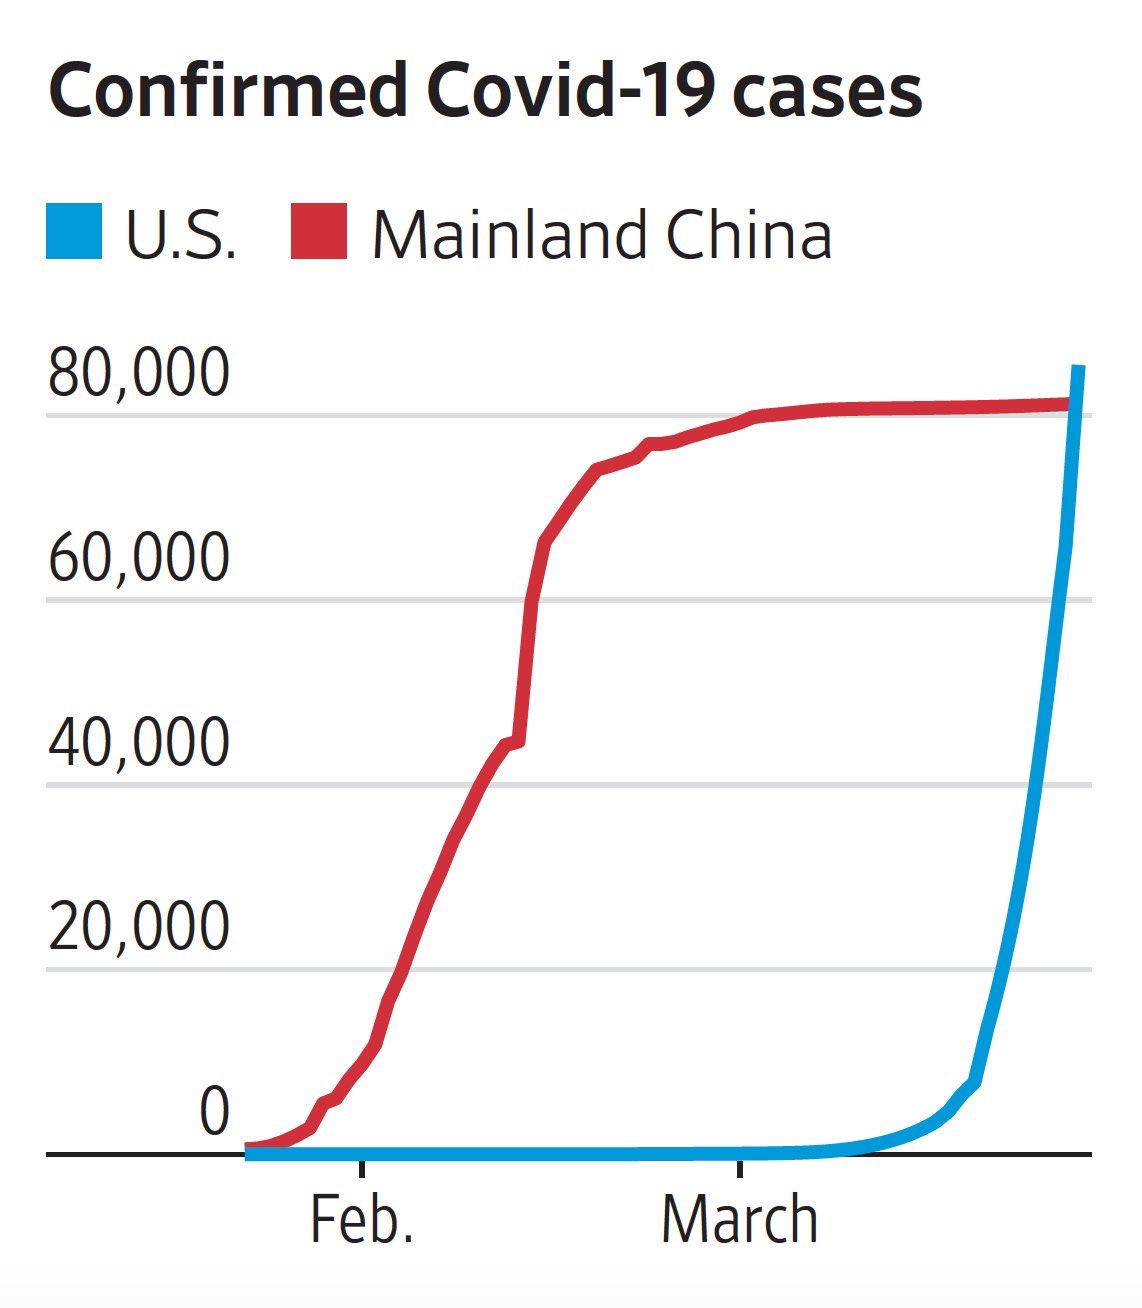
A friend shared this on my Facebook feed. To all my data savvy friends out there, can you spot the issues with this graphic from an objectivity perspective?

1