

Passionate Trader. AUTOMATION AND SOFTWARE SPECIALIST for stock market. Spread positivity. It costs nothing. Free Education.
Joined February 2014
- Tweets3.6K
- Following12
- Followers622
- Likes15.5K






Pinned Tweet
Every feature you have seen or heard of is included in the vast array, even across and timeframes and stocks, if you want to check which are the ones forming a particular pattern or near a trendline, it shows you the same.
This is one of the first in India to have an automated Elliot Wave for all Indian stocks.

On this auspicious day me and my team (@taptradinghub, @manojs2784) are excited to launch conflutics.com an AI backed research platform which will be giving analysis for both Indian and US markets including Cryptos.
For years I read ~220 NSE F&O names across every timeframe by hand — 5m to monthly — hunting for the one thing that matters: where the timeframes agree.
Every market feature you have ever come through,
now on one single screen.
━━━━━━━━━━━━━━
WHAT'S INSIDE
🧩 CONFLUENCE MATRIX
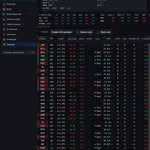
~220 F&O names × 8 timeframes in a single grid — filters, scans and saved views.
🏁 RANKINGS
Top-10 bull and bear lists for every timeframe, and what changed since the last pass.
🦅 EAGLE EYES
The eyrie — names meeting 3 or more of 6 conditions, with entries and exits flagged as they happen.
📐 STRUCTURE & LEVELS
A structure score from −10 to +10 per name, per timeframe · trendlines, chart patterns, pivots, reclaims and rejections.
⛓️ OPTIONS DESK
PCR · OI build-ups (long build-up · short build-up · short covering · long unwinding) · gamma exposure · max pain · IV rank · strike sentiment · futures basis.
🌡️ MARKET BREADTH
Advance/decline · % above EMAs · sector contribution · index vs heavyweights · FII/DII flows.
🎯 TRADE RESEARCH
Intraday, positional and option-selling setups — entry, stop-loss, target, and the reasoning behind each one.
🧪 RESEARCH LABS
Elliott wave lab · volume profile · option scanner · macro and world markets · academy.
🔔 ALERTS THAT REACH YOU
New setups, exits, OI and price movers, VIX and PCR extremes — on your phone and desktop, even with the app closed. Choose LOW, MEDIUM or HIGH.
🗞️ NEWS, FILTERED
Pre-market global cues · India after-market brief · world brief. Headline, source, link — nothing else.



Read this tweet again!

Since reliance is in news, its worth mentioning something here.
At Covid Avwaps, and 6 years of non performance when you see it more of a base with unlocking of JPL and a volume based much more than standard deviation move,
KNOW THAT SOMETHING HAS MOVED, A NEEDLE HAS STARTED A NEW CLOCK.

1
119
Long time back, one of my mentors told me - You have to live through one entire bull cycle and one entire bear cycle, to understand that something has shifted and you need to change sides at least on a bias basis.
Riding the larger trend is far more easier.
111
Did you ride the Bull? 😁
Nifty ...2000 points in 6 days.
Since reliance is in news, its worth mentioning something here.
At Covid Avwaps, and 6 years of non performance when you see it more of a base with unlocking of JPL and a volume based much more than standard deviation move,
KNOW THAT SOMETHING HAS MOVED, A NEEDLE HAS STARTED A NEW CLOCK.
TAP(Time and Price) Trading retweeted

Indian Sailor Stuck in Karachi for 7 Months, Family Desperate
Merchant navy officer Vineet Kishore Mishra and five other Indian seafarers have been stranded on a cargo ship at Karachi port since April. Passports held by authorities, contracts expired, supplies short, and health risks rising. His family in Prayagraj (including 3-year-old son asking “when will Papa come home?”) has appealed to PM, President and MEA with little result.
Please retweet so their voice is heard.
iamrakeshbansal.com

TAP(Time and Price) Trading retweeted

Mobile PLI stats as follows:
Government incentive paid: Rs 19,000 Cr.
Direct tax collected: Rs 25,000 Cr.
GST collected: Rs 3,00,000 Cr.
Electronics manufacturing employs 25 Lakh people; mobile manufacturing alone employs 12 Lakh.
Cope harder!!

One in four iPhones is made in India, but imported parts and costly subsidies complicate the success story. @andymukherjee70 takes apart an iPhone to explain why copying China's manufacturing model may not pay off 🎥
Prepared to be surprised tmrw about what we bring to the Cash feature at Conflutics. Unique and something of a scale not attempted in CASH segment.
Cant wait? Want to see before the announcement? Well, sign up beforehand today at Conflutics. And you can see the beauty!
Feature 4: Confluence Cash Ranking
Oh there is one more added feature under CASH segment;
Confluence Rank started with 224 F&O stocks. Now
its going to be covering NIFTY 1000 stocks.
Most of the market isn't in F&O, and a lot of the strongest trends start in stocks that have no derivatives at all.
So we took the whole engine to the cash segment. It's been a big build. 🧵
1. The scale-up: 224 stocks → ~1,000 stocks. More than 4x the universe.
Each still gets the full treatment: 10 signal blocks × 6 timeframes = 60 readings. That's ~60,000 readings, combined into one ranked board in under a second.
Needless to say Options data wont be there rest of the paramenters have been applied here and it works quite nicely.
2. Why it matters: yesterday's example
The F&O board had zero longs. In the cash market, the engine found 51.
Top of the long side: IGIL +64, ACI +62, IPCALAB +61, TTML +61, SSWL +58
An effort of almost 6-8 months and the result is worth the effort. Can say nothing like this been seen in Indian Cash segemnt. Happy Trading


1
185
And when you click the ranked tab in the rankings on Conflutics, you can select intraday and positional and see exactly which ones are stringest and weakest.

Feature 3: Meet Confluence Rank 🧵👇
One screen. Every stock. Every timeframe. One verdict.
conflutics.com/rankings
1: The engine
Most check 3–4 indicators on 1–2 timeframes and call it confluence
We built a tool that checks 15+ indicators, along with chart patterns, Volume profile, OI data etc across timeframes, for every F&O stock, and which gives consensus verdict
Scored on 5m, 15m, 30m, 60m, Daily, 2D (+ Weekly & Monthly for context)
Output: one conviction score, −100 to +100
Any stock selected in one timeframe will show corresponding ranking in other timeframes.
2: Two horizons
Intraday (5m–60m) and Positional (2–3 days+).
Same stocks, different weighting. A name can be a strong intraday long but a weak positional one, and the board shows it.
3. The scale
10 signal blocks × 6 timeframes = 60 readings per stock.
224 F&O stocks = 13,000+ readings.
All combined into one ranked board, re-ranked in milliseconds.
4. Cross-timeframe confluence
The time-wise view finds names in the Top 10 on 3+ timeframes at once.
Bears: SWIGGY 5/8, SHRIRAMFIN, HYUNDAI 4/8
Bulls: ANANDRATHI, INDHOTEL 6/8, HCLTECH 5/8
Even in a weak tape, it finds the pockets of strength.
5: The top of the board
The highest-conviction name for the horizon, with why:
Yesterday : HYUNDAI −81, Strong Short
4/4 intraday timeframes aligned
Driven by Trend + Volume
Higher timeframe still building
6: The ranked board. Every stock gets:
• Verdict (Strong Long → Strong Short)
• Conviction score
• Bull vs bear split
• Timeframe heatmap (5m → M)
• Setup tag: Scalp / Swing 2–3D / Swing 5D+
• Chop flag, with a toggle to hide chop
7: Drill into any stock. See exactly where the score comes from


2
215
TAP(Time and Price) Trading retweeted

Feature 3: Meet Confluence Rank 🧵👇
One screen. Every stock. Every timeframe. One verdict.
conflutics.com/rankings
1: The engine
Most check 3–4 indicators on 1–2 timeframes and call it confluence
We built a tool that checks 15+ indicators, along with chart patterns, Volume profile, OI data etc across timeframes, for every F&O stock, and which gives consensus verdict
Scored on 5m, 15m, 30m, 60m, Daily, 2D (+ Weekly & Monthly for context)
Output: one conviction score, −100 to +100
Any stock selected in one timeframe will show corresponding ranking in other timeframes.
2: Two horizons
Intraday (5m–60m) and Positional (2–3 days+).
Same stocks, different weighting. A name can be a strong intraday long but a weak positional one, and the board shows it.
3. The scale
10 signal blocks × 6 timeframes = 60 readings per stock.
224 F&O stocks = 13,000+ readings.
All combined into one ranked board, re-ranked in milliseconds.
4. Cross-timeframe confluence
The time-wise view finds names in the Top 10 on 3+ timeframes at once.
Bears: SWIGGY 5/8, SHRIRAMFIN, HYUNDAI 4/8
Bulls: ANANDRATHI, INDHOTEL 6/8, HCLTECH 5/8
Even in a weak tape, it finds the pockets of strength.
5: The top of the board
The highest-conviction name for the horizon, with why:
Yesterday : HYUNDAI −81, Strong Short
4/4 intraday timeframes aligned
Driven by Trend + Volume
Higher timeframe still building
6: The ranked board. Every stock gets:
• Verdict (Strong Long → Strong Short)
• Conviction score
• Bull vs bear split
• Timeframe heatmap (5m → M)
• Setup tag: Scalp / Swing 2–3D / Swing 5D+
• Chop flag, with a toggle to hide chop
7: Drill into any stock. See exactly where the score comes from
Feature 2: ELLIOTT WAVE LAB
🌊 ELLIOTT WAVE ANALYSIS — complexity simplified Often regarded as one of the most tedious, subjective, and difficult-to-automate disciplines in technical analysis, Elliott Wave analysis has found a powerful new home at conflutics.com/
What the page does
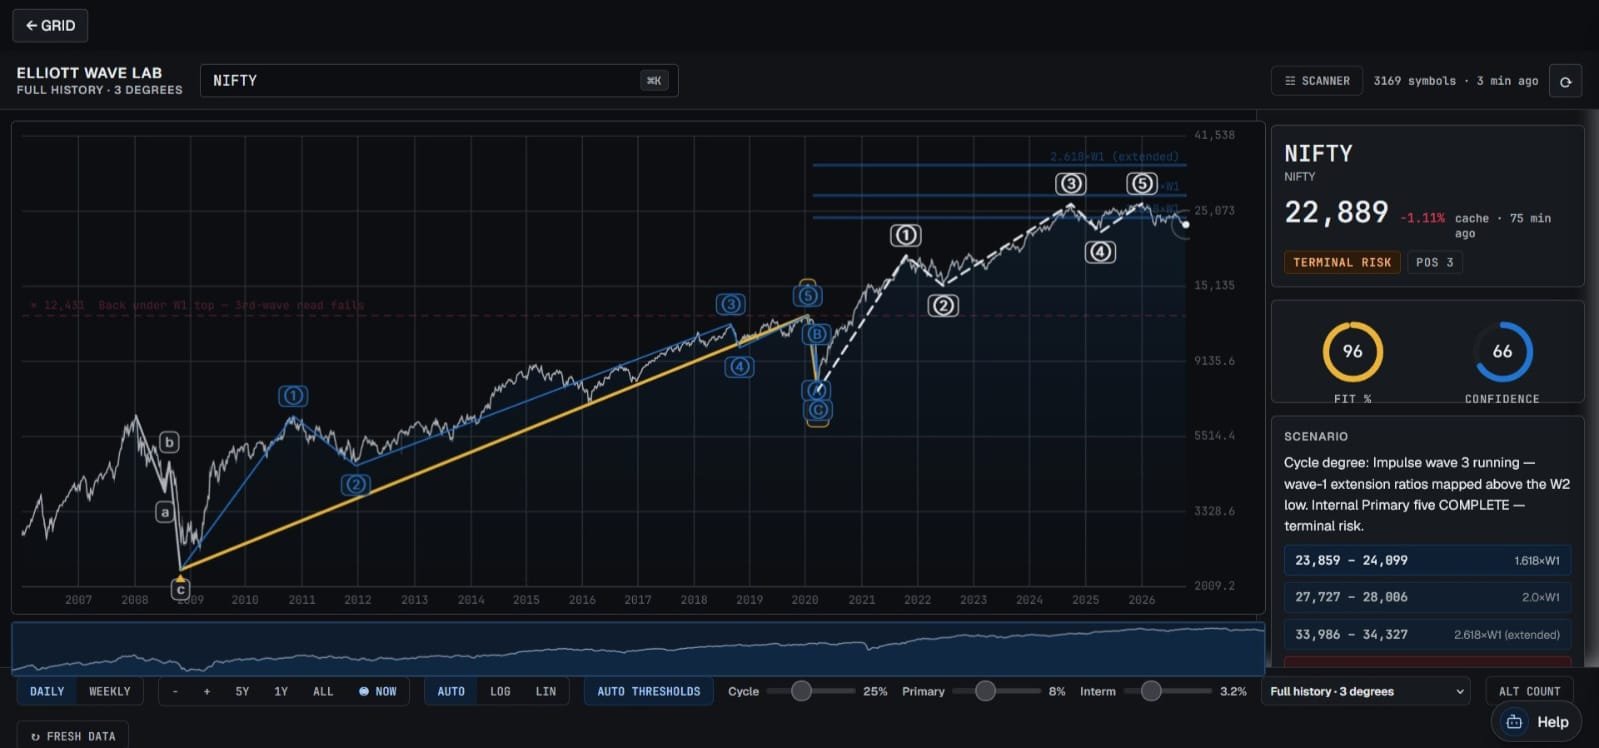
Elliott Wave Lab automatically counts Elliott waves across a symbol’s full price history at three degrees at once: Cycle, Primary and Intermediate.
Each count gets a fit score and a confidence score, so the user can see how cleanly price matches the wave model. A scanner runs the same engine across the whole universe
Simply type in any stock and explore a clean, structured Elliott Wave count — without the hours of manual chart analysis.
⚡ And here's the game-changer:
Filter specifically for Wave 3 and Wave iii of 3 — the powerful momentum phases Elliott Wave traders look for when hunting high-potential opportunities.
Less clutter. Less guesswork. A clearer view of market structure.
What once demanded painstaking manual effort is now accessible in just a few clicks.
The waves are there. The challenge is identifying them. We've made that easier.
🚀 Explore Elliott Wave Analysis on conflutics.com


TAP(Time and Price) Trading retweeted

Great one ! Going to explore for sure ! May best wishes 👍👍
Calling out all Elliot enthusiasts.
Painstaking manual work is now on a click!
Often regarded as one of the most tedious, subjective, and difficult-to-automate disciplines in technical analysis, Elliott Wave analysis has found a powerful new home at Conflutics.
Even with AI, you will find its extremely difficult to automate Elliot. But guess what, we did!
Simply type in any stock and explore a clean, structured Elliott Wave count — without the hours of manual chart analysis.
⚡ And here's the game-changer:
Filter specifically for Wave 3 and Wave iii of 3 — the powerful momentum phases Elliott Wave traders look for when hunting high-potential opportunities.
What once demanded painstaking manual effort is now accessible in just a click.
The waves are there. The challenge is identifying them. We've made that easier.
Calling out all Elliot enthusiasts.
Painstaking manual work is now on a click!
Often regarded as one of the most tedious, subjective, and difficult-to-automate disciplines in technical analysis, Elliott Wave analysis has found a powerful new home at Conflutics.
Even with AI, you will find its extremely difficult to automate Elliot. But guess what, we did!
Simply type in any stock and explore a clean, structured Elliott Wave count — without the hours of manual chart analysis.
⚡ And here's the game-changer:
Filter specifically for Wave 3 and Wave iii of 3 — the powerful momentum phases Elliott Wave traders look for when hunting high-potential opportunities.
What once demanded painstaking manual effort is now accessible in just a click.
The waves are there. The challenge is identifying them. We've made that easier.
Feature 2: ELLIOTT WAVE LAB
🌊 ELLIOTT WAVE ANALYSIS — complexity simplified Often regarded as one of the most tedious, subjective, and difficult-to-automate disciplines in technical analysis, Elliott Wave analysis has found a powerful new home at conflutics.com/
What the page does
Elliott Wave Lab automatically counts Elliott waves across a symbol’s full price history at three degrees at once: Cycle, Primary and Intermediate.
Each count gets a fit score and a confidence score, so the user can see how cleanly price matches the wave model. A scanner runs the same engine across the whole universe
Simply type in any stock and explore a clean, structured Elliott Wave count — without the hours of manual chart analysis.
⚡ And here's the game-changer:
Filter specifically for Wave 3 and Wave iii of 3 — the powerful momentum phases Elliott Wave traders look for when hunting high-potential opportunities.
Less clutter. Less guesswork. A clearer view of market structure.
What once demanded painstaking manual effort is now accessible in just a few clicks.
The waves are there. The challenge is identifying them. We've made that easier.
🚀 Explore Elliott Wave Analysis on conflutics.com


TAP(Time and Price) Trading retweeted
Feature 2: ELLIOTT WAVE LAB
🌊 ELLIOTT WAVE ANALYSIS — complexity simplified Often regarded as one of the most tedious, subjective, and difficult-to-automate disciplines in technical analysis, Elliott Wave analysis has found a powerful new home at conflutics.com/
What the page does
Elliott Wave Lab automatically counts Elliott waves across a symbol’s full price history at three degrees at once: Cycle, Primary and Intermediate.
Each count gets a fit score and a confidence score, so the user can see how cleanly price matches the wave model. A scanner runs the same engine across the whole universe
Simply type in any stock and explore a clean, structured Elliott Wave count — without the hours of manual chart analysis.
⚡ And here's the game-changer:
Filter specifically for Wave 3 and Wave iii of 3 — the powerful momentum phases Elliott Wave traders look for when hunting high-potential opportunities.
Less clutter. Less guesswork. A clearer view of market structure.
What once demanded painstaking manual effort is now accessible in just a few clicks.
The waves are there. The challenge is identifying them. We've made that easier.
🚀 Explore Elliott Wave Analysis on conflutics.com


TAP(Time and Price) Trading retweeted

When we think about gravity as a concept, we tend to go with our thoughts to Isaac Newton and his apple, but an idea of gravity as attractive force, was first suggested by Indian astronomer Brahmagupta in the year 628 CE.
He called it "gurutvākarṣaṇ".

TAP(Time and Price) Trading retweeted

"When we applied the soft kill [over Bholari], look what happened to it."
BrahMos happened. 📸 :@vantortech


This is a living proof as to why the people of Pakistan are at lowest rung of Education
What's novel is you can select any pattern type(lets say Head and Shoulders) and see all the stocks and all the timeframes in which a stock is forming Head and shoulders
Under Trendline/Pattern Scan, this is what it looks like. Multitime frame support /resistance and Patterns at one glance. Happy Trading.
conflutics.com

4
170
TAP(Time and Price) Trading retweeted
Under Trendline/Pattern Scan, this is what it looks like. Multitime frame support /resistance and Patterns at one glance. Happy Trading.
conflutics.com
On this auspicious day me and my team (@taptradinghub, @manojs2784) are excited to launch conflutics.com an AI backed research platform which will be giving analysis for both Indian and US markets including Cryptos.
For years I read ~220 NSE F&O names across every timeframe by hand — 5m to monthly — hunting for the one thing that matters: where the timeframes agree.
Every market feature you have ever come through,
now on one single screen.
━━━━━━━━━━━━━━
WHAT'S INSIDE
🧩 CONFLUENCE MATRIX
~220 F&O names × 8 timeframes in a single grid — filters, scans and saved views.
🏁 RANKINGS
Top-10 bull and bear lists for every timeframe, and what changed since the last pass.
🦅 EAGLE EYES
The eyrie — names meeting 3 or more of 6 conditions, with entries and exits flagged as they happen.
📐 STRUCTURE & LEVELS
A structure score from −10 to +10 per name, per timeframe · trendlines, chart patterns, pivots, reclaims and rejections.
⛓️ OPTIONS DESK
PCR · OI build-ups (long build-up · short build-up · short covering · long unwinding) · gamma exposure · max pain · IV rank · strike sentiment · futures basis.
🌡️ MARKET BREADTH
Advance/decline · % above EMAs · sector contribution · index vs heavyweights · FII/DII flows.
🎯 TRADE RESEARCH
Intraday, positional and option-selling setups — entry, stop-loss, target, and the reasoning behind each one.
🧪 RESEARCH LABS
Elliott wave lab · volume profile · option scanner · macro and world markets · academy.
🔔 ALERTS THAT REACH YOU
New setups, exits, OI and price movers, VIX and PCR extremes — on your phone and desktop, even with the app closed. Choose LOW, MEDIUM or HIGH.
🗞️ NEWS, FILTERED
Pre-market global cues · India after-market brief · world brief. Headline, source, link — nothing else.