

𝑁𝑜𝑙𝑖 𝑇𝑖𝑚𝑒𝑟𝑒, 𝐴𝑢𝑑𝑒𝑛𝑡𝑖𝑠 𝐹𝑜𝑟𝑡𝑢𝑛𝑎 𝐼𝑢𝑣𝑎𝑡. ᴰᵒ ⁿᵒᵗ ᵇᵉ ᵃᶠʳᵃᶦᵈ, ᶠᵒʳᵗᵘⁿᵉ ᶠᵃᵛᵒʳˢ ᵗʰᵉ ᵇʳᵃᵛᵉ.
Joined February 2022
- Tweets6.9K
- Following108
- Followers2K
- Likes36.6K




Pinned Tweet
Good morning, everyone.
Today, I’m going to explain something to all of you in simple terms —something that no one else out there is currently explaining.
Growth + easing financial conditions: the mix that has historically helped risk assets
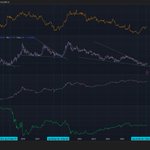
On the chart I put together four indicators plus one crypto ratio. This is not a precise timing signal. It is a snapshot of regime: when the economy holds up and financial conditions are easing rather than tightening, markets tend to reward risk. Crypto sits in that category.
What is on the chart
At the top: ETH/BTC, i.e. how much Ethereum is worth versus Bitcoin.
Then the copper/gold ratio: copper lives on industry and real demand, gold on fear and protection. If copper starts outperforming gold again, the market is betting more on growth.
Then NFCI and, to be read together with it, ANFCI (Chicago Fed).
At the bottom: ISM Manufacturing PMI, the US factory purchasing managers’ index.
In plain language
ISM Manufacturing PMI tells you whether factories are expanding or contracting. Above 50 = expansion. In August 2026 it printed 54.6: an eighth straight month above 50. That is not a boom, but the manufacturing cycle is still growing.
NFCI measures whether US financial conditions are tighter or easier than their historical average (credit, markets, banks, funding). A negative reading means easier than average. Latest print (week ending September 4): -0.56.
ANFCI goes one step further: it strips out what is already explained by the economic cycle. It asks whether financial conditions are easier even relative to current growth and inflation. Latest print: -0.59. So this is not just “the economy is fine, therefore markets look calm.” Conditions remain easy even after adjusting for the cycle.
One important note: this kind of setup can appear regardless of whether the Fed is cutting, hiking, or holding rates. NFCI and ANFCI are not the policy rate. They capture the whole financial environment: credit spreads, market volatility, funding, leverage, equity and debt conditions. Rates can stay unchanged, or even rise, and conditions can still ease. The opposite is also true: a rate cut does not automatically mean easier conditions if credit tightens and risk appetite fades.
Copper/gold on the chart is trying to turn higher. That is a market signal, not an official statistic: when it rises, appetite for real activity and cyclical risk usually improves.
Why the combination matters
One piece alone is not enough.
Growth with tightening credit can choke volatile assets.
Easier conditions with a falling economy often push money into havens (dollar, gold, Treasuries).
When activity holds (PMI above 50, copper/gold stopping its decline) and financial conditions are easing rather than tightening (NFCI and ANFCI both negative), liquidity tends to move down the risk ladder. Historically, that backdrop has been one of the more favorable setups for cyclical equities, riskier credit, and crypto.
On the chart I highlighted similar phases in the past, especially around 2016–2017: PMI in expansion, easier financial conditions, copper/gold recovering. This is not an automatic replay. It is the same type of regime.
What ETH/BTC is doing in this picture
ETH/BTC is not “the whole crypto market.” It is an internal thermometer: when it rises, Ethereum (and often part of the alt complex) is outperforming Bitcoin. In broader risk-on periods, that ratio has had a better chance of breathing. The chart puts it in context: not because the ratio “must” explode, but because the macro backdrop is not tightening-plus-recession.
What to watch next
September ISM: if it stays above 52–53, the growth signal holds.
NFCI and ANFCI (usually Wednesday; next update September 16): a further decline confirms easing; a jump toward zero challenges it.
Copper/gold: if it rolls over again while gold runs on its own, the market is choosing defense once more.
In short: an economy that is not breaking + financial conditions that stay easy (both NFCI and ANFCI in easing territory) is a recipe that, in recent history, has favored high-risk assets. The chart does not forecast the price of ETH or BTC. It describes the climate. And the climate, for now, is Risk-on.


Solresearcher ⚡︎ retweeted

$BTC Bitcoin - Reminder on the “According to historical data” that can be a bit misleading as a generality.
Again I'm a small account around here but let me remind you that:
Large audience ≠ expertise ≠ always being right ≠ guaranteed outcomes.
So it really depends on which conditions we choose to look at in the historical data. For example, according to Bitcoin’s short history, under the following conditions, previous major low areas held:
🔸Weekly RSI to oversold and then reclaim of 50w SMA
🔸Weekly RSI to oversold and then supertrend flips green
🔸Weekly RSI to oversold and then reclaiming 55
🔸Monthly RSI below 50 and then two monthly closes above the SMA10m
Probably a good reminder to be shared and spread around.


Crypto Bros when $BTC crashes under 60K over the next few weeks (according to Historical data):
"Okay but you have to understand there was manipulation, XYZ happened, MY ANALYSIS WAS ACCURATE! I WAS NOT WRONG. We just crashed because XYZ happened"
Markets don't care about the fan fiction version of what was supposed to happen, and the chart has no customer service department where you can dispute transactions.
Okay, enough making fun of the "I was right, but then reality happened" analysts. 😂
Let me introduce you to the REAL charting legends.
These are the people whose charts I actually pay attention to for confluence.
Phenomenal track records, years of receipts, Calls made publicly BEFORE the move, tweets stay up whether they are right OR wrong. No deleting history.
No moving goalposts, no "my analysis was accurate, but XYZ happened" bs, no blaming manipulation every time price disagrees with them.
Those are the analysts I respect. 🫡
Now let me introduce you to some absolute legends... 👇
@bitsofwealth
@Natnatx007
@CalvinWeight
@0xBadPrice
@DevEngineOz
@CryptoLandy
@NorthstarCharts
@WOLF_Crypto_X (William)
@WOLF_Terminal (the lined-drawOoOOoors crew)
Give them a follow and tag your favorites in the comments!
We have reached a point where, for about 6 years, BTC has done practically nothing. If, by the end of this decade, it were to be worth not just one million, but millions, I wouldn’t be surprised.

It’s been a while since I last updated the chart of USDT.D.+USDC.D. I think the next fun phase is almost here.


Solresearcher ⚡︎ retweeted
The COPPER/GOLD ratio is on the rise again and on the lower time frames we are about to surpass the high of early August. Personally, I do not see signs of a significant industrial slowdown. August has always been the month when people go on vacations and work comes to a halt for a few weeks, and that is exactly what the chart is telling us at this point. Acceleration towards the end of the year is the most likely scenario from here.

This phase is really boring, but it won’t last much longer; look closely at the two charts, and you’ll see that the ongoing evolution is already providing the answer as to what comes next.


Modern society appears devastated. Trust has been shattered, systems are creaking, and there is a pervasive sense that a societal cycle is coming to an end.
Yet, this long-term chart—comparing circulating currency to gold—tells a different story: one of recurring, secular cycles. Periods of fear and contraction are invariably followed by collective awakenings.
Today, we find ourselves near one of these historic lows. The structures, support levels, and rhythms within the chart suggest that the correction is reaching maturity. According to long-term projections, what follows is not a void, but rather a wave of global, collective enthusiasm.
This is not naive optimism; it is an awareness of how these cycles unfold. Whenever humanity has reached the nadir of trust, something new has emerged.
In the context of this chart, the future no longer dwells on social decline—for that phase has reached its conclusion—but instead shifts its focus toward the collective rebirth of society.

On October 2, after the weak September jobs print (+29k versus expectations near 90k, with negative revisions of 60k and unemployment rising to 4.2% because people entered the labor force, not because layoffs surged), the 2-year fell to 4.69 while the 10-year sat near 5.25. That was the first real sign that the front end was leading lower and that the second October hike was dying in the pricing. We called it the first green: the direction was finally right, but the second half of the fail was still missing.
In the weeks that followed, the inflation data stayed hot. September CPI (October 14) showed headline around +0.6% m/m and core +0.33%. The next day PPI came in much stronger (+1.3% m/m and +6.3% y/y, core +0.7%), while retail sales beat at +0.8% and claims remained low near 199k. Despite those numbers, yields did not turn back up. The 2-year kept easing and the 10-year gradually gave back the early-October highs.
Friday October 23 close
The 2-year finished around **4.69%**. That is the fourth straight weekly decline and the lowest level since mid-September. The 10-year closed near **4.99%**, under 5% for the first time in days after dipping to about 4.95 on Thursday. From the early-October highs (5.31–5.33) it is down more than 30 bp. 10-year TIPS have moved lower into the **2.64–2.78%** area. Brent rose to roughly **$117** on Friday, while Bitcoin stayed around **$81k**, essentially flat on the week.
October hike odds have collapsed., with hike odds under 10%. December still shows a 25 bp hike around 73%. The market has decided October is not the moment for the second move, even after the hot CPI and PPI. The 2-year confirms this more clearly than it did on October 2.
Where the map stands
Compared with the October 2 post we are further along. The 2-year is leading lower and no longer making highs. The 10-year has stopped making highs and closed under 5%. TIPS have rolled over. October hike odds are dead. This is a more solid green than the one we saw on October 2.
It is still not the full fail. Oil at $117 keeps some pressure on breakevens and the long end. The 10-year has not yet fallen and held cleanly under 4.95. The term premium on the long end has not disappeared. A cleaner signal would require the 10-year to lose 4.90–4.95 in a sustained way and TIPS to keep rolling.
This is still not the boom window for crypto. It is the clearest signal so far that the October path is off and that the 10-year has stopped accelerating. Crypto still waits on the second half of the fail.
From Monday
The 2-year under 4.70 is the level to defend. If it holds and the 10-year stays under 5.05, the green becomes more durable. If oil remains above $115 and the next data (or Wednesday’s FOMC) re-ignite the long end, pressure returns. Cash stays in bills until the 10-year confirms the ceiling.

Hi guys, here is the update I promised you yesterday after the unemployment data and jobs print.
The map is finally moving in the right direction. Not done. Pointing the right way for the first time since we tagged 5%.
The original read was simple. The 10-year had to tag 5% and decide. If both yields kept making highs together, the test was still on and crypto waited. If the 2-year started leading lower while the second hike died and real yields rolled over, that was the fail, and the fail was the tape where liquidity could come back. A 2-year fade with the 10-year still heavy was only the first green, not the boom.
We got the tag, then more than the tag. The September 16 hike was unanimous and priced. The 5-year on the 23rd was the first ugly coupon sale, 5.033% with a 3.1bp tail. By October 1 the 10-year was at 5.30–5.34, highest since 2002, and the 30-year at 5.66. PCE had cooled October odds and done nothing to the long end. That was the wrong direction: policy pausing for an hour, term premium still in charge.
Today is the turn. September added 29,000 jobs versus 90,000 expected, below every estimate. August cut from 162,000 to 133,000. July from +21,000 to −10,000. Revisions −60,000. Unemployment 4.2% from 4.1%, because 485,000 people entered the labor force, not because layoffs broke. Participation 61.8%. Wages +0.1% on the month, 3.0% on the year, slowest since 2021. Household survey +406,000. Cooling, not a break. Enough to take October off the table. A hold is now the base case, near 70%. December is softer, not dead.
The 2-year fell to 4.69, the first real trip under 4.80 since the September flickers, both of which died the next session. It then came back toward 4.80–4.82. The 10-year dipped near 5.20 and is back around 5.25. The 30-year is still above 5.60. The rally lasted about an hour. The long end is still pricing deficits, oil and the global selloff.
That is still the right side of the map. For three weeks the risk was 5% becoming a floor and both yields making highs together. Today the front end led lower and the second hike for October died in the pricing. That is the sequence the original post needed first. What is missing is the second half: the 2-year staying under 4.75, the 10-year stopping at 5.25 instead of bouncing, TIPS actually rolling. Until those show up it is the first green, not the fail, and crypto still waits on the fail.
Monday is the confirmation. A close under 4.75, held, means the turn sticks. A return to 4.90 means the payrolls were digested and we are back in the test. Direction is finally right. The close is what makes it real.
UPDATE — 24 October 2026
Same eight-point frame. Markets closed for the weekend. Levels are the 23 October close. Oil has become the dominant short-term driver: a supply shock is lifting headline inflation, weighing on gold, and keeping the long end of the curve elevated while the front end prices an October hold. The FOMC meets 27–28 October. A hold is the base case; a December hike is the priced path.
1. What happened, in one sentence
Oil surged on renewed geopolitical risk, September CPI confirmed sticky energy-driven inflation, claims stayed extremely low, and the market shifted from pricing an October hike to pricing a hold with a December follow-up.
2. The yield curve (the Fed thermometer)
Friday 23 October close, approximate:
- Fed funds target: 3.75–4.00% (effective ~3.88%).
- US 2-year: 4.69%.
- US 10-year: 5.00%.
- US 30-year: 5.33%.
- 2s10s: about +31 bp (still positive, not inverted).
The curve remains upward-sloping. The front end has eased from the mid-September highs as markets priced out an October hike. The long end has not: the 10-year is still near 5% and the 30-year is above 5.3%. This is consistent with “the Fed may skip October, but rates are not done rising and the term premium / inflation premium stays in place.” The 2-year is the market’s vote on the next few meetings; it is no longer pricing an immediate hike. The 10-year and 30-year are still voting on oil, inflation persistence, and fiscal concerns.
3. Gold, oil, copper
Oil is the main story. Brent has pushed above $116 (some prints near $117), a multi-month high, driven by attacks on Saudi energy infrastructure, shipping risks, and broader Middle East tensions. WTI is around $103. This is a supply shock, not a pure demand boom. It lifts headline CPI without proving the US economy is overheating on its own.
Gold has broken below $4,000, trading around $3,996–$4,008. It is having one of its weaker weeks in months. Higher oil raises the probability that rates stay higher for longer; real rates and a firmer dollar are the direct pressure. This is a rates-driven correction, not a collapse of the broader risk or debasement narrative.
Copper is around $6.51 per pound, off its earlier records but not collapsing. The copper/gold ratio remains softer than the August peak. That fits an early-tightening environment: the real economy is still standing, but markets are pricing the cost of money and the inflation impulse from oil.
4. Equities, dollar, Bitcoin
S&P 500 closed around 7,650 on Friday, modestly lower on the week amid AI-related volatility and the oil/inflation mix. Not a crash. Nasdaq has been more sensitive to the AI spending debate. The dollar index (DXY) is around 101.8, firm but not extreme. Bitcoin is trading near $80,000–$81,500, consolidating after recent swings. Crypto is not driving the macro narrative right now; oil and the Fed path are.
5. The data that holds the picture together
Recent releases (since early October):
- September CPI (14 October): headline +0.6% month-on-month, 3.7% year-on-year (from 3.4%). Core +0.3% month-on-month, 2.6% year-on-year (from 2.4%). Energy +5.2% on the month and roughly +20% year-on-year. Gasoline was the main driver. Core was a bit hotter than expected. This is the energy shock showing up in the consumer basket.
- September PPI: final demand rose sharply (reports cite roughly +1.3% month-on-month), pushing the year-on-year rate higher. Pipeline prices are not cooling cleanly.
- September payrolls (2 October): +29,000 (well below expectations), unemployment 4.2% (from 4.1%). Revisions earlier were negative. Soft hiring, but not a crack.
- Initial claims (week ending 17 October): 194,000, four-week average around 198,000. Continuing claims rose modestly to about 1.73 million. Low-hire, low-fire. No layoff wave.
- August core PCE: still around 3.0% year-on-year after earlier revisions. Headline PCE was higher.
- Q2 GDP: revised to roughly +2.2%. Growth is moderate, not stalling.
- Retail sales: positive on the month. Activity is holding.
The puzzle is unchanged in structure but sharper in detail: activity and labor (claims) are resilient; hiring is soft; inflation is sticky because of energy and still-elevated core; oil is reaccelerating the headline. The Fed’s own earlier SEP had core PCE around 3.4% at year-end. The September CPI does not make that easier.
6. The 1989–1995 parallel, said simply
We remain in the post-hold phase that began with the September hike (unanimous +25 bp to 3.75–4.00%, median 2026 dot near 4.1%). That was the first step of a 1994-style sequence. In 1994 the Fed hiked, activity stayed firm, and more hikes followed. Here the September payrolls were soft and claims are extremely low, so the labor market is not forcing the next step immediately. Oil and the September CPI are doing the work that stronger labor might otherwise have done.
A single hike does not kill a soft landing. A sequence driven by persistent energy inflation does. We are still closer to “one or two more steps possible” than to a full 1994 run to 6%. The long end of the curve (10-year near 5%, 30-year above 5.3%) is already behaving as if the inflation and term premiums are not finished. The AI capex overlay is unchanged: large relative to GDP and mostly cash-flow financed, which is why activity can absorb higher rates without an immediate demand collapse.
7. Updated probabilities
- Goldilocks / balanced soft landing: 34–40%. Still the cleanest description of “no recession and moderate growth.” It is no longer the majority view on policy. Oil above $110–115 and the September CPI make the “rates stay high and stable” part harder.
- Weaker soft landing: contained. Claims at 194,000 and the household survey do not support a sharp deterioration. Soft hiring is real but limited.
- Recession: about 8–10%. Labor data do not support it. Copper is softer but not in free fall.
- Sticky inflation / more aggressive hiking: 42–50%, still the lead scenario on the policy side. October hold is priced (~85–92% probability). December hike is widely expected by economists and futures. Oil and the CPI are the channels that keep this elevated. If Brent stays above $110 into the PCE and next CPI prints, the probability of a second hike (or more) rises further.
In short: the real economy is still closer to Goldilocks than to recession. Policy and markets are closer to “the Fed is not done and oil is making it harder.”
8. What to watch (in order)
1. FOMC 27–28 October. No SEP. The statement and Warsh’s press conference matter more than the 25 bp decision (hold is the base case). Any language on inflation, oil, or “conditions are not yet restrictive” will move the 2-year.
2. Oil. Brent sustained above $110–115 keeps the December hike mechanical. A sharp drop toward $100 eases the pressure.
3. September PCE (29 October, with Q3 GDP advance). Core PCE is the Fed’s preferred measure. A rise from 3.0% or a sticky headline will reinforce the December path.
4. 2-year yield. Holding near 4.70% or higher means the market still sees more than one additional hike. A clear break below 4.60% would price a longer pause.
5. 10-year and 30-year. A 10-year that stays near or above 5% and a 30-year that drifts toward 5.5% keep the fiscal and inflation premiums alive regardless of the October decision.
6. Claims and copper/gold. Claims remaining under 200,000 support “no recession.” A sustained drop in copper relative to gold would say tightening is starting to bite cyclical demand.
The September hike opened the door. The September CPI and the oil spike have kept it open. October looks like a hold. The next veto is oil and the September PCE. Until those clear, the picture is a soft landing that can still be interrupted by energy.
UPDATE, 3 October 2026 - week close.
Same eight-point frame as 10,17 and 24 September. Not a straight line to a second hike. PCE on 30 September was cooler than feared, mostly a methods revision. Friday's payroll was weak. Long yields did not give up 5%.
1. In one sentence
The real economy is standing and August spending was strong, but September hiring slowed and core PCE printed 3.0% after a statistical revision. October is no longer almost closed. 1994 is open,not automatic.
2. The yield curve
Friday 2 October. Fed funds 3.75-4.00%, midpoint 3.875%. US 2-year about 4.82-4.83%, from about 4.90%: part of the October hike came off. US 10-year about 5.25-5.28%, touched about 5.34-5.35%, a 20-year high. US 30-year about 5.60-5.63%, through the 5.50% fiscal line. 2s10s about plus 40 to 45 bp, steeper again, not the 10 September bear-flatten. Front end calmed on payrolls; the long end did not. The 2-year is a weaker vote for a second hike. The 10-year and 30-year still vote on inflation, oil and debt.
3. Gold, oil, copper
Brent about 102 dollars, WTI about 91. Friday dip on diesel-release talk; Brent not under 100. Supply shock, not a US demand boom. Gold about 4,130-4,150, from about 4,300. Copper about 6.53 dollars a pound, off the records. Copper to gold weaker than August: early tightening.
4. Equities, dollar
S&P about 7,720, recovering after the soft payroll. The dollar touched 102, then eased Friday.
5. The data
25 September: durable goods flat, minus 0.02%. Ex-transport plus 0.3%. Core capex plus 1.6%, fourth gain, plus 14% year on year. Michigan final 48.1, from 51.7. Inflation expectations 4.6% at one year, 3.4% at five years.
30 September: PCE plus 0.3% on the month, 3.4% on the year. Core plus 0.2%, 3.0%. July revised from 3.3% to 3.0%; part of the drop is methodology, about 36 bp. Not back at 2%. Spending plus 0.9% nominal, 0.6% real. Q2 GDP revised to 2.2% from 1.5%. Q1 to 2.5%.
2 October: payrolls plus 29,000 versus about 90,000. Unemployment 4.2% from 4.1%. Wages plus 0.1% on the month, 3.0% on the year, slowest annual pace since 2021. August revised from 162,000 to 133,000, July to minus 10,000, combined minus 60,000. Three-month average about 51,000. Household survey stronger: employment plus 406,000, participation 61.8%.
Activity and spending hot. Core 3.0%, above target, not worsening. Labor soft enough to take urgency out of October. Brent still three digits. Long curve still tense.
6. 1989-1995
The 1993 hold closed on 16 September. First 25 bp hike done, vote 12-0, median dot about 4.1%. This week added what February 1994 lacked: a 29,000 payroll and a core revised down. Not a return to 1993. A 1994 that can stop at one or two steps instead of running to 6%. Bonds are already in that season, even if October is skipped.
7. Probabilities, 3 October
Goldilocks, balanced soft landing: 38-44%, up from 30-36% on 24 September. Not a majority: Brent above 100 and the 10-year above 5.2% keep the lid on.
Weaker soft landing: contained, less remote. The 29,000 print supports it; claims around 197,000 and household employment plus 406,000 limit it.
Recession: about 9-11%. A touch higher. 29,000 with unemployment at 4.2% is not 1990.
Sticky inflation, more aggressive hiking: 40-46%, no longer in clear lead.
An October hold drops it below Goldilocks.
8. What to watch
FOMC 27-28 October, no SEP. The payroll gives Warsh the sentence to skip. The 10-year at 5.25% and Brent at 102 say do not promise the end.
Oil: Brent under 95 pushes the second hike out. Above 110 makes it mechanical.
2-year: under 4.70% prices one-and-done. Above 4.95% and October is live.
30-year: above 5.60% the fiscal premium is on, independent of the Fed.
September CPI around 13 October. Michigan preliminary on 9 October. September PCE lands after the Fed.
Copper to gold: a bounce says the cycle can live with funds at 4%. Another leg down says the cost of money is biting.
The veto sits with oil and September PCE. Until then, limping Goldilocks.
Good morning everyone; given the current state of the market, my only question for you is: should we have patience until 2027, or until 2028?

This picture is becoming increasingly even more clear; what’s more? the US 10-year and 2-year yields are also falling—things couldn’t be looking any better.
Tomorrow, at the close of the economic week, I will come with the updated overview.


Solresearcher ⚡︎ retweeted
Hi everyone.
There’s an alignment worth watching which no one talks about: American industry and growth expectations are improving together.
Two different indicators — one that measures what has already happened and one that measures what the market expects — are moving in the same direction. And it’s exactly this alignment that makes the signal more interesting.
**INDPRO: Real production is rising**
The Federal Reserve’s Industrial Production Index measures the physical volume of what is produced in the United States (manufacturing, mining, and utilities). It’s not a survey: it’s hard data.
In September 2026 it rose to **104.0** (2017=100), the highest level since 2018. The month posted a **+0.7%** increase, the strongest monthly gain since April. It’s the sixth consecutive month of growth, and the third quarter closed at **+2.8%** annualized.
It’s not an explosive boom, but it’s a clear turnaround from the stagnation of recent years.
**Copper/Gold: The market is pricing in more growth**
The Copper/Gold ratio is a classic barometer of economic expectations. Copper is a pure industrial metal (construction, autos, electricity, data centers, AI). Gold is the ultimate safe-haven asset.
When the ratio rises, the market is pricing in stronger industrial activity and growth. When it falls, it is pricing in slowdown or risk-off.
Between January and February 2026 the ratio hit a multi-year low (one of the lowest in decades). Since then it has recovered solidly. This is not just a technical bounce: while gold corrected from its highs, copper held up relatively better, supported also by structural demand tied to electrification and AI data centers.
**Why the alignment matters**
INDPRO tells us that real production is increasing.
The Copper/Gold ratio tells us that the market expects this growth to continue.
When a coincident (or slightly lagging) indicator and a leading indicator move in the same direction, the signal becomes more robust. It’s no longer just “the data is improving” or just “the market is optimistic.” It’s both.
Of course, it’s not all smooth sailing. In September the main contribution came from utilities (+3.5%), while automotive output fell 3%. Growth is not yet broad-based across classic manufacturing. But the underlying picture has changed compared to the start of the year.
After months in which gold outperformed copper and industrial production remained anemic, both indicators are now improving together.
This kind of alignment guarantees nothing, but historically it is one of the cleanest signals that the industrial cycle is improving.

Good morning guys, nothing has changed since i posted this simple step-by-step guide. Apart from BTC, which has risen in the meantime, got several confirmations on different charts , and people keep losing patience.


Hi everyone.
There’s an alignment worth watching which no one talks about: American industry and growth expectations are improving together.
Two different indicators — one that measures what has already happened and one that measures what the market expects — are moving in the same direction. And it’s exactly this alignment that makes the signal more interesting.
**INDPRO: Real production is rising**
The Federal Reserve’s Industrial Production Index measures the physical volume of what is produced in the United States (manufacturing, mining, and utilities). It’s not a survey: it’s hard data.
In September 2026 it rose to **104.0** (2017=100), the highest level since 2018. The month posted a **+0.7%** increase, the strongest monthly gain since April. It’s the sixth consecutive month of growth, and the third quarter closed at **+2.8%** annualized.
It’s not an explosive boom, but it’s a clear turnaround from the stagnation of recent years.
**Copper/Gold: The market is pricing in more growth**
The Copper/Gold ratio is a classic barometer of economic expectations. Copper is a pure industrial metal (construction, autos, electricity, data centers, AI). Gold is the ultimate safe-haven asset.
When the ratio rises, the market is pricing in stronger industrial activity and growth. When it falls, it is pricing in slowdown or risk-off.
Between January and February 2026 the ratio hit a multi-year low (one of the lowest in decades). Since then it has recovered solidly. This is not just a technical bounce: while gold corrected from its highs, copper held up relatively better, supported also by structural demand tied to electrification and AI data centers.
**Why the alignment matters**
INDPRO tells us that real production is increasing.
The Copper/Gold ratio tells us that the market expects this growth to continue.
When a coincident (or slightly lagging) indicator and a leading indicator move in the same direction, the signal becomes more robust. It’s no longer just “the data is improving” or just “the market is optimistic.” It’s both.
Of course, it’s not all smooth sailing. In September the main contribution came from utilities (+3.5%), while automotive output fell 3%. Growth is not yet broad-based across classic manufacturing. But the underlying picture has changed compared to the start of the year.
After months in which gold outperformed copper and industrial production remained anemic, both indicators are now improving together.
This kind of alignment guarantees nothing, but historically it is one of the cleanest signals that the industrial cycle is improving.
As I told you yesterday, this is just a transitional phase. Keep growing that pair of balls.


The truth is that most people who attempt to analyze the market overlook a fundamental aspect: it is not up to us to determine the market's emotional state—the market decides that itself. Our only task is to identify in which state it is currently ; once we have done so, we must detach ourselves from it. Only then—provided you possess the necessary knowledge— you can attempt to explain certain dynamics and analyze the market from a long-term perspective. This is precisely why I don't give a dime on the 90% of what I read, around here.
PS: Bullish flags are no longer a fashion, and it seems people have completely forgotten what they look like, because no one is recognizing them anymore.