

Investor since 2014 | Equity Research (🇮🇳 India & 🇺🇸 US) | Concentrated Portfolios | Not SEBI Regd | Tweets Not Reco
India
Joined October 2015
- Tweets9.2K
- Following279
- Followers1.7K
- Likes8.3K





Pinned Tweet
Yatharth Hospital: Current Position & Way Forward
Yatharth Hospital & Trauma Care Services is currently trading around ₹640; nearly 24% below its 52-week high of ₹844.
Despite the correction, Q3 FY26 delivered explosive growth (record revenue and profits) though margins saw slight pressure.
📊 What’s Happening Right Now
🚀 Supercharged Growth
🔹 Net profit surged 48.7% YoY to ₹45.3 Cr.
🔹 Revenue jumped 46.2% YoY to ₹320.5 Cr.
📉 Margin Compression
🔹 EBITDA margin softened to 23.2% (down 185 bps YoY).
🔹 Scaling costs from new hospitals kicking in.
💪 Strong Fundamentals
🔹 ARPOB grew 10% YoY to ₹33,744.
🔹 Net cash position remains solid at ₹200 Cr.
🌉 What Could Drive Upside
🏥 New Hospitals Coming Online
🔹 New Delhi + Faridabad units contributed 9% of revenue in their first full quarter.
📈 Aggressive Expansion Plan
🔹 Target: 5,000 beds in 3 years.
🔹 Recent acquisitions (like Agra) integrating smoothly.
🧬 Specialty Mix Upgrade
🔹 Oncology to reach 15% of specialty revenue in 1.5-2 years.
🔹 Higher ARPOB + better margins ahead.
🌩️ What Could Go Wrong
⚠️ Margin Pressure Near-Term
🔹 New hospital ramp-up + integration costs weighing on profitability.
🏥 Occupancy Gap in New Units
🔹 Noida: strong at 91% occupancy.
🔹 Faridabad: lagging at 43%.
🔹 Needs to cross 50%+ guidance.
🌍 Macro Risk Alert
🔹 Brent crude above $100.
🔹 Could trigger inflation ➡️ higher hospital operating costs.
📉 Valuation & Technical Setup
🔹 Stock corrected from ₹844 ➡️ ₹640.
🔹 P/E 37x ➡️ premium, but justified by high growth.
🔹 Market is betting on: 5,000-bed execution + continued ARPOB expansion.
🎯 What Lies Ahead
🔹 Occupancy ramp-up in Faridabad & New Delhi to >50%.
🔹 EBITDA margins stabilizing at 24-25% by FY27.
🔹 Riding India’s structural healthcare demand + strong M&A execution.
@DhawalDoshi5 @TrendSpark420

Mahindra & Mahindra: A Snapshot
👉 M&M is trading around ₹3,214; nearly 16% below its 52-week high of ₹3,840.
👉 Yet, Q3 FY26 tells a very different story ➡️ stellar performance, powered by Auto & Farm segments delivering record-breaking revenue + strong profitability.
📊 Current Status
🔸 Profit & Revenue Surge: Q3 FY26 net profit jumped 47% YoY to ₹4,675 Cr. Revenue crossed ₹50k Cr for the first time, rising 26% to ₹52,100 Cr.
🔸 Auto Dominance: SUV revenue market share climbed to 24.1% (+90 bps) ➡️ strengthening M&M’s grip on the premium UV space.
🔸 Broad-Based Growth: It’s not just autos; financial services, logistics, and real estate arms all delivered breakout profitable quarters, showcasing operating leverage across the group.
🌉 Potential Tailwinds
🔸 SUV & EV Pipeline: Strong response to launches like XEV 9S & XUV 7XO ➡️ boosting high-margin auto growth.
🔸 Tractor Resilience: Volumes up 23%, backed by festive + harvest demand. M&M continues to dominate with 44.1% YTD market share.
🔸 Services Turnaround: Tech Mahindra gaining traction, while Mahindra Logistics turns profitable after 11 quarters.
🌩️ Potential Headwinds
🔸 Macro Risks: Brent crude above $100 ➡️ inflation risk, higher input costs, and potential slowdown in demand.
🔸 EV Transition Execution: Global EV push needs heavy capex; margins could take a hit if adoption lags.
🔸 Rural Vulnerability: Tractor growth hinges on monsoons + rural liquidity; any stress here could impact the Farm segment.
📉 Technicals & Valuations
🔸 Stock corrected from ₹3,840 ➡️ ₹3,214.
🔸 Trading at ~23x P/E ➡️ reasonable considering 47% profit growth + strong return ratios.
🔸 Markets are pricing in SUV leadership + turnaround of ‘Growth Gems’ (subsidiaries).
🔸 A break below key support could still trigger further downside, despite strong fundamentals.
🎯 Future Outlook
🔹 Capacity expansion underway; targeting 3,000-5,000 units/month addition by mid-2026 to reduce backlogs.
🔹 Management aiming for a solid 18% RoE with disciplined capital allocation.
🔹 Diversification paying off ➡️ non-auto businesses steadily increasing their share of profits.
@DhawalDoshi5 @TrendSpark420

4
16
633
ICICI Prudential Life Insurance: A Snapshot
👉 ICICI Pru is trading around ₹584, nearly 17% below its 52-week high of ₹707.
👉 Q3 FY26 delivered mixed signals ➡️ strong profitability, but pressure on premium growth.
📊 Current Status
🔸 Profit Outpacing Revenue: Q3 FY26 net profit jumped 19.6% YoY to ₹390 Cr, while net premium income fell 3.7% to ₹11,809 Cr.
🔸 Margin Expansion: VNB margins expanded to 24.4% ➡️ clear evidence that the shift toward high-margin products is working.
🔸 Strong Fundamentals: Solvency ratio stands at a healthy 214.8%, with AUM growing to ₹3.31 Lakh Cr.
🌉 Potential Tailwinds
🔸 Retail Protection Boom: Retail protection APE surged 40.8% YoY, supported by GST reforms ➡️ boosting the high-margin segment.
🔸 Margin Sustenance: Improved product mix + disciplined cost control are offsetting GST-related profitability pressures.
🔸 Stable Customer Traction: Overall APE grew 3.6% to ₹2,525 Cr, indicating resilient retail new business growth.
🌩️ Potential Headwinds
🔸 Persistency Concerns: 13-month persistency dropped to 81% (vs 85.6% YoY) ➡️ a sign of retention challenges in new policies.
🔸 Topline Drag: Decline in single premium income is weighing on overall gross premium growth.
🔸 Macro Risks: Brent crude above $100 remains a key risk ➡️ Could drive inflation, reduce disposable income, and slow premium growth indirectly.
📉 Technicals & Valuations
🔸 Stock corrected from ₹707 ➡️ ₹584.
🔸 Trading at ~61x P/E, indicating premium valuation.
🔸 Market is pricing in continued margin expansion & recovery in persistency.
🔸 A break below support could trigger further downside, despite strong profit growth.
🎯 Future Outlook
🔹 Continued shift toward high-margin products (Retail Protection & Non-Linked) to sustain VNB margins.
🔹 Management focus on improving 13-month & 61-month persistency ratios.
🔹 Benefiting from financialization of savings and growth in India’s insurance & wealth ecosystem.
@DhawalDoshi5 @TrendSpark420

4
13
2,933
Mazagon Dock Shipbuilders: A Snapshot
👉 MDL is currently trading near ₹2,328, down roughly 38% from its 52-week high of ₹3,778.
👉 The defense shipbuilding giant recently posted strong Q3 FY26 numbers but remains caught in a technical downtrend.
📊 Current Status
🔸 Profit Outpacing Revenue: Q3 FY26 net profit rose ~9% YoY to around ₹880 Cr, while consolidated revenue grew 14.5% to ₹3,601 Cr.
🔸 Margin Expansion: EBITDA margins stood strong at 24.6%, proving MDL is successfully translating topline growth into bottom-line profitability.
🔸 Strong Fundamentals: The company is virtually debt-free with a highly impressive ROCE of ~43.3%.
🌉 Potential Tailwinds
🔸 Massive Order Book: Sitting on an order book north of ₹23,700 Cr, providing multi-year revenue visibility.
🔸 Fresh Inflows & MoUs: Recent strategic moves, including a trilateral MoU involving Brazil for Scorpene-class maintenance, open doors to high-margin service revenue.
🔸 Margin Sustenance: Achieved over 75% indigenization in P17A Stealth Frigates, significantly insulating margins from currency volatility.
🌩️ Potential Headwinds
🔸 Execution Timelines: Margin volatility remains a concern as the pacing of critical submarine and destroyer deliveries dictates quarter-to-quarter performance.
🔸 Macro Risks: As a heavy manufacturing player in Indian Industry, Brent crude crossing $100 remains a critical red flag that could compress margins by indirectly elevating logistics and input costs.
🔸 Operational Glitches: Persistent supply chain bottlenecks for critical marine components highlight the constant operational risks involved in defense manufacturing.
📉 Technicals & Valuations
🔸 The stock has corrected from ₹3,778 ➝ ₹2,328, trading inside a descending channel and below major 50 & 200-day moving averages.
🔸 Valuations remain premium for a PSU at ~38x P/E, meaning near-perfect execution is already heavily priced in.
🔸 A break below current support levels could invite further selling pressure, despite the stellar fundamental earnings.
🎯 Future Outlook
🔹 Pacing of the P15B Destroyers and P17A Stealth Frigates delivery schedules.
🔹 Continued transition from pure construction to a higher mix of submarine maintenance and service revenue.
🔹 Development and scaling of indigenous platforms like Next Generation Destroyers and export potential to friendly nations.
@DhawalDoshi5 @TrendSpark420

Hindustan Aeronautics Limited: A Snapshot
👉 HAL is currently trading near ₹3,914, down roughly 24% from its 52-week high of ₹5,166.
👉 The defense giant recently posted strong Q3 FY26 numbers but remains caught in a technical downtrend.
📊 Current Status
🔸 Profit Outpacing Revenue: Q3 FY26 net profit surged 30% YoY to ₹1,867 Cr, while revenue grew 10.7% to ₹7,699 Cr.
🔸 Margin Expansion: EBITDA margins improved to 24.3%, proving HAL is successfully translating topline growth into bottom-line profitability.
🔸 Strong Fundamentals: The company is virtually debt-free with a highly impressive ROCE of ~33.9%.
🌉 Potential Tailwinds
🔸 Massive Order Book: Sitting on an order book north of ₹1.89 Lakh Cr, providing multi-year revenue visibility.
🔸 Fresh Inflows: Recent ₹2,901 Cr contract for ALH Mk-III helicopters and ₹2,312 Cr for Dornier 228 aircraft strengthen its dominant domestic monopoly.
🔸 Margin Sustenance: Strong operating leverage is kicking in as manufacturing scales up and defense indigenization accelerates.
🌩️ Potential Headwinds
🔸 Execution Timelines: Persistent supply chain bottlenecks for critical engine components could drag out LCA Tejas Mk1A deliveries.
🔸 Macro Risks: As a heavy manufacturing player in Indian Industry, Brent crude crossing $100 remains a critical red flag that could compress margins by indirectly elevating logistics and input costs.
🔸 Operational Glitches: Recent software issues leading to a Tejas runway incident highlight the constant operational risks involved in aerospace manufacturing.
📉 Technicals & Valuations
🔸 The stock has corrected from ₹5,166 ➡️ ₹3,914, trading inside a descending channel and below major moving averages.
🔸 Valuations remain premium for a PSU at ~30x P/E, meaning near-perfect execution is already heavily priced in.
🔸 A break below current support levels could invite further selling pressure, despite the stellar fundamental earnings.
🎯 Future Outlook
🔹 Pacing of the Tejas Mk1A delivery schedule and export potential to friendly nations.
🔹 Continued transition from a repair/overhaul-heavy revenue mix to a high-margin manufacturing-led model.
🔹 Development and scaling of indigenous platforms like the Advanced Medium Combat Aircraft (AMCA) and Indian Multi Role Helicopter (IMRH).
@DhawalDoshi5
@TrendSpark420

Asian Paints near 52W Low: A Snapshot
👉 Asian Paints is trading near ₹2,221, dangerously close to its 52-week low (₹2,162).
👉 The stock is caught between strong demand growth and intense margin pressure.
📊 Current Situation
🔸 Revenue vs Profit Gap: Q3 FY26 revenue grew 3.9% YoY to ₹8,867 Cr, but profit fell 4.8% YoY to ₹1,074 Cr due to exceptional charges.
🔸 Volume-Value Mismatch: Decorative segment volumes grew 7.9%, but value growth was only 2.8% ➡️ showing aggressive price cuts across the sector.
🌩️ Macro Risks
🔸 Crude Oil Warning: Brent crude crossing $100 is a major risk. Paint companies are highly crude-linked, which could compress margins quickly.
🔸 Rising Competition: New deep-pocketed entrants are forcing incumbents into price wars instead of pricing power.
🌉 What’s Still Working?
🔸 Industrial coatings are delivering double-digit growth.
🔸 International business (UAE, Sri Lanka, Ethiopia) grew 6.3%.
🔸 Strong ROCE ~25.7% with a dominant distribution network.
📉 Technicals & Valuation
🔸 The stock has corrected from ₹2,985 ➡️ ₹2,221 and sits in oversold territory.
🔸 Yet valuation remains rich at ~52-55x P/E.
🔸 Meaning: any margin pressure from crude could trigger more downside.
🎯 What to Watch Next?
🔹 Ability to manage crude-driven cost pressure.
🔹 Outcome of industry price wars.
🔹 Growth from industrial & international segments.
@DhawalDoshi5 @TrendSpark420

ITC Limited: Company Deep Dive
Context:
ITC is currently trading ~₹309, hovering close to its 52-week lows. The stock is digesting recent tax hikes and one-off provisions, even as its non-cigarette FMCG business hits new profitability milestones.
📊 Q3 FY26 Earnings: Stable Growth, Optical Profit Pressure
🔸 Revenue Momentum: Consolidated revenue grew 6.6% YoY to ₹21,706 Cr, supported by strong performance in FMCG and Agri segments.
🔸 Profit Impact: Net profit remained flat at ₹5,018 Cr, largely due to a ₹355 Cr one-time provision linked to the implementation of new Labour Codes.
🔸 FMCG Inflection: The FMCG-Others segment delivered 11% YoY revenue growth, while segment PBIT surged 42%, with digital-first & organic brands growing 60% YoY.
🔸 Cigarette Engine: The core cigarette business posted 8% YoY revenue growth, reflecting strong pricing power and resilient demand.
🌩️ Key Risks Ahead
🔸 Tax Overhang: The February 2026 excise duty hike on cigarettes could impact volumes and test ITC’s pricing strength.
🔸 Paperboard Margin Pressure: The Paperboards, Paper & Packaging segment faces margin compression due to cheap imports and weak realizations.
🔸 Cost Pressures: Labour code implementation signals rising employee and operating costs going forward.
🌉 Structural Growth Drivers
🔸 FMCG Profit Engine: ITC’s decades of investment in non-tobacco FMCG are finally paying off, with the segment transitioning from investment phase to margin expansion.
🔸 Dividend Strength: With a dividend yield above 4.6%, ITC remains a cash-flow powerhouse. The ₹6.50 interim dividend reinforces its strong shareholder payout track record.
📉 Technical Setup & Valuation
🔸 Demand Zone: The stock has corrected from its ₹444 high and is consolidating near a key support band of ₹300–₹310.
🔸 Valuation Comfort: Trading near ~11x P/E with almost zero debt, the downside appears relatively protected.
🔸 Trend Reversal Trigger: A decisive move above the 50-DMA near ₹333 could signal renewed institutional interest.
🔸 Accumulation Phase: While tax concerns may cap near-term upside, the risk-reward favors long-term yield-focused investors.
🎯 Big Picture
🔹 ITC is evolving from a tobacco-dominated company into a diversified FMCG powerhouse.
🔹 It remains a classic defensive stock, combining steady FMCG growth with strong dividend income.
Tweet for educational purposes only.
No Reco.
@DhawalDoshi5 @TrendSpark420

4
14
1,600
Titan Company: The Premiumization Engine Driving India's Lifestyle Boom
Context: TITAN is currently trading around the ₹4,200 mark, absorbing some minor consolidation near its all-time highs while its core jewellery and premium lifestyle engine remains incredibly resilient despite surging commodity prices.
📊 Q3 Performance: Blockbuster Growth Masking Volume Nuances
🔸 Revenue Scaling: Consolidated revenue surged a massive 43% YoY to ₹25,416 Cr, fueled by a stellar festive and wedding season.
🔸 Profitability Surge: Net profit jumped an exceptional 61% YoY to ₹1,684 Cr, showcasing severe operational leverage and improved margins (EBIT margin expanded 155 bps to 10.8%).
🔸 Jewellery Dominance: The core jewellery segment grew 42% YoY to ₹22,517 Cr. While actual buyer footfalls remained relatively flat, a "fear of missing out" (FOMO) around record gold prices dramatically expanded average ticket sizes.
🔸 Watch & Wearable Resilience: The segment clocked ₹1,295 Cr (up 14% YoY). While smartwatches saw a 27% volume dip due to market moderation, the premium analog segment drove steady growth and maintained a healthy 12% EBIT margin.
🌩️ The Macro Headwinds (Commodities & Margins)
🔸 The Gold Price Paradox: While elevated gold prices boost immediate revenue through higher ticket sizes, sustained hyper-inflation in bullion could eventually trigger volume compression and demand destruction.
🔸 Margin Mix Pressures: An unfavourable product mix (specifically a heavier reliance on plain gold coins and chains over high-margin studded jewellery during high-price environments) can weigh on blended gross margins.
🔸 Discretionary Squeeze: With broader inflationary pressures keeping domestic wallets tight, discretionary spending could see a pullback in the lower-tier consumer segments, making growth heavily reliant on the affluent demographic.
🌉 Thematic Tailwinds (The Formalization Megatrend)
🔸 The Organized Shift: As the regulatory environment continues to tighten around unorganized jewelers (mandatory hallmarking, transparency), TITAN is aggressively capturing market share in this massive transition to organized retail.
🔸 The Premiumization Proxy: As India's middle class expands and shifts focus from mere gold accumulation to lifestyle upgrading and brand affinity (Tanishq, Zoya, Mia), Titan provides a massive multi-decade runway as the premier consumption beneficiary.
📉 Chart Structure & Technical Setup
🔸 Consolidation Phase: After hitting a fresh 52-week high of ₹4,378 in mid-February following the Q3 earnings beat, the stock has slightly cooled off and is currently consolidating near the ₹4,240 levels.
🔸 Immediate Support: The ₹4,150 to ₹4,180 zone serves as a crucial near-term technical floor, where institutional accumulation has historically absorbed recent pullbacks.
🔸 Upside Hurdles: To resume the parabolic sequence, the price action needs a decisive breakout above the ₹4,380 supply zone on heavy volumes.
🔸 Valuation Floor: Trading at premium multiples (P/E near 79x), the stock demands flawless execution; however, an industry-leading ROE north of 31% provides a comfortable moat for long-term accumulators.
🎯 The Big Picture
🔹 TITAN is a colossal, brand-driven lifestyle ecosystem capturing India’s premiumization story.
🔹 The stock remains a premier proxy play on domestic discretionary consumption and wealth creation.
Tweet for educational purposes only.
No Reco.
@DhawalDoshi5 @TrendSpark420

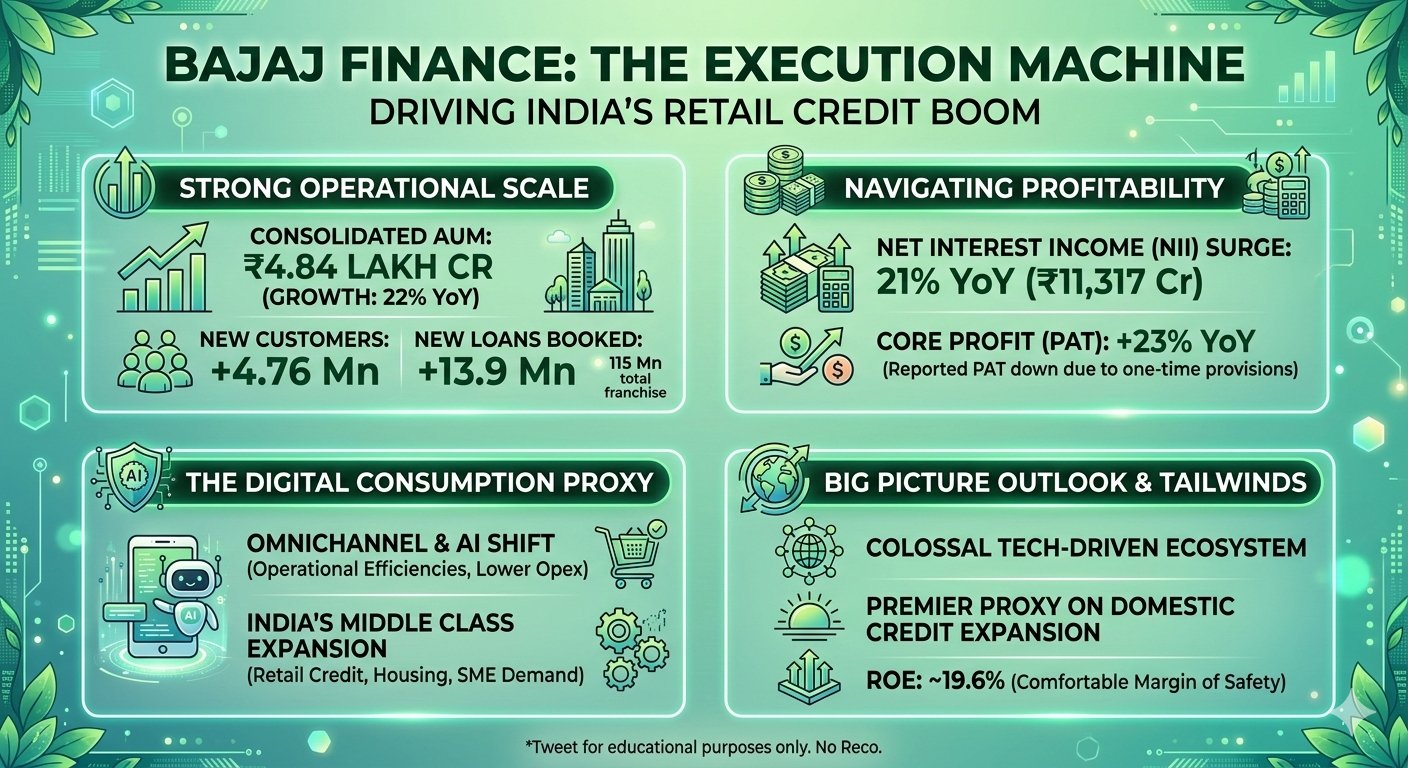
Bajaj Finance: The Execution Machine Driving India's Retail Credit Boom
Context: BAJFINANCE is currently trading around the ₹950 mark, absorbing some short-term regulatory shocks while its core customer acquisition engine and AUM growth remain incredibly strong.
📊 Q3 Performance: Solid Core Masked by One-Offs
🔸 AUM Scaling: Consolidated AUM grew a robust 22% YoY, crossing the massive ₹4.84 lakh Cr milestone.
🔸 Customer Acquisition Engine: Added a staggering 4.76 million new customers and booked 13.9 million new loans in just 90 days, pushing the total franchise to 115 million.
🔸 NII Expansion: Net Interest Income surged 21% YoY to ₹11,317 Cr, driven by relentless loan momentum.
🔸 Profitability Nuance: While reported PAT slipped ~6% YoY due to conservative one-time provisions (accelerated ECL) and new labor codes, Core PAT actually jumped 23% YoY, showcasing underlying operational leverage.
🌩️ The Macro Headwinds (Yields & Commodities)
🔸 The Crude Threat: With Brent crude flirting with the $100 per barrel red flag, inflation risks could keep domestic interest rates higher for longer, squeezing margins for NBFCs.
🔸 Cost of Funds Pressure: As the broader credit cycle matures, securing cheaper liabilities becomes tougher, putting slight pressure on borrowing costs across the financial sector.
🔸 FII Liquidity: Tightening global liquidity and a risk-off environment often lead to FII trimming in high-beta financials, impacting short-term price action.
🌉 Thematic Tailwinds (The Digital Consumption Megatrend)
🔸 Omnichannel & AI Shift: BAJFINANCE is heavily leveraging AI for DIY customer servicing and loan disbursements, driving massive operational efficiencies and structurally lowering Opex.
🔸 The Consumption Proxy: As India's middle class expands, the demand for retail credit, housing finance, and SME loans provides a massive multi-decade runway for growth, positioning Bajaj as the premier beneficiary.
📉 Chart Structure & Technical Setup
🔸 Cooling Off Phase: The stock has corrected from its 52-week highs of ₹1,102 and is currently consolidating below its short-term moving averages amid broader market pullbacks.
🔸 Immediate Support: The ₹930 to ₹940 zone serves as a crucial technical floor, where institutional buying interest has historically emerged.
🔸 Upside Hurdles: To reverse the current sequence, the price action needs a decisive push above the ₹980 to ₹1,000 supply zone on heavy volumes.
🔸 Valuation Floor: Maintaining a core ROE near 19.6% despite higher provisioning, the underlying fundamental metrics offer a comfortable margin of safety for long-term accumulators.
🎯 The Big Picture
🔹 BAJFINANCE is a colossal, tech-driven financial ecosystem capturing India’s consumption story.
🔹 The stock remains a premier proxy play on domestic credit expansion.
Tweet for educational purposes only.
No Reco.
@DhawalDoshi5 @TrendSpark420
4
7
6,986
Motilal Oswal (MOFSL): The Wealth Compounder Riding India's Financialization Wave
Context: MOFSL is currently trading around the ₹715 mark, navigating broader market volatility while its core asset and wealth management engines fire on all cylinders.
📊 Q3 Report Card: Firing on All Cylinders
🔸 Top-Line Acceleration: MOFSL delivered a solid 11.3% YoY jump in Net Revenue to ₹1,497 Cr for Q3 FY26, heavily propelled by its Asset and Private Wealth Management divisions.
🔸 Bottom-Line Surge: Operating profit after tax hit a record high of ₹611 Cr (up 16% YoY), reflecting massive operating leverage.
🔸 Asset Management Power: AUM witnessed a stellar 31% YoY growth, nearing the ₹1.96 lakh Cr milestone, proving the stickiness of its client base.
🔸 Broking Resilience: Despite broader market choppiness, cash volume market share remained robust at 6.9%, showcasing the strength of its execution platform.
🌩️ The Macro Headwinds (Crude & Capital Flights)
🔸 The Brent Crude Red Flag: With Brent crude prices threatening the $100 per barrel mark, it remains a red flag for the broader Indian financial and industrial sectors, as inflation fears risk delaying vital rate cuts and squeezing margins.
🔸 Tech Contagion: Recent broad-market selloffs triggered by AI-disruption fears in the IT sector have created a risk-off environment, indirectly pressuring capital market stocks as retail sentiment takes a hit.
🔸 FII Outflows: As global liquidity tightens amid geopolitical friction, high-beta financial services stocks often face the initial brunt of foreign institutional selling.
🌉 Thematic Tailwinds (The Financialization Mega-Trend)
🔸 Predictability Shift: MOFSL is aggressively moving towards recurring revenue models, with Annual Recurring Revenue (ARR) now contributing over 60% of total net revenues, offering a massive moat against market cycles.
🔸 The Wealth Runway: As India's affluent class expands, the transition from physical assets (gold/real estate) to financial assets provides a multi-decade structural growth runway for MOFSL's Private Wealth arm.
📉 Price Action & Technical Setup
🔸 Consolidation Phase: The stock has corrected from its 52-week highs and is currently absorbing the recent broad-market pullback, trading below its short-term moving averages.
🔸 Immediate Support: The ₹700 to ₹715 psychological zone acts as a critical floor, where value-buying interest historically emerges.
🔸 Upside Hurdles: To break the current sequence, the price action needs a decisive breakout above the ₹740 to ₹750 supply zone on strong volumes.
🔸 Valuation Floor: With a robust Return on Equity (ROE) consistently sitting above 25%, the fundamental metrics provide a solid margin of safety at current levels.
🎯 The Big Picture
🔹 MOFSL is rapidly transforming from a traditional broker into a highly diversified, resilient wealth management powerhouse.
🔹 The stock remains a high-conviction proxy play on the expanding Indian capital markets and domestic liquidity.
Tweet for educational purposes only.
No Reco.
@DhawalDoshi5 @TrendSpark420

Syrma SGS: The EMS Growth Engine Navigating Global Supply Chain Shocks
Context: Syrma SGS is currently trading around the ₹770 mark, caught in the broader EMS correction amidst severe risk-off sentiment.
🏭 Q3 Earnings: Blockbuster Growth in a Volatile World
🔸 The Revenue Engine: Syrma delivered a standout Q3 FY26, with revenue surging 45% YoY to ₹1,274 Cr, driven by robust order inflows in the IT and Railways segments.
🔸 Profitability Check: Net profit jumped a massive 108% YoY to ₹110 Cr. The growth was heavily supported by strong operating leverage and an improved product mix.
🔸 The Margin Reality: EBITDA margins expanded sharply by 350 bps to 12.6%. The company is proving its pricing power and scale efficiencies.
🔸 Export Surge: Export revenues skyrocketed 66% YoY to ₹335 Cr, showcasing global traction even in a fragmented macro environment.
🌍 The Macro Crucible (Oil Shocks & Supply Chain Friction)
🔸 The Brent Crude Red Flag: With the US-Iran conflict escalating, Brent crude threatening the $100 per barrel mark flashes a glaring red flag for the broader Indian industrial and manufacturing sectors due to spiking freight and component costs.
🔸 Geopolitical Supply Chain Risks: The disruption of key shipping routes threatens to squeeze raw material availability, a direct hurdle for component-heavy EMS players.
🔸 Risk-Off Panic: Emerging markets are facing a severe risk-off environment. High-beta manufacturing stocks like Syrma are bearing the brunt of the immediate geopolitical panic selling, marked by recent gap-downs.
🌉 Thematic Bridge (China+1 vs Global Fragility)
🔸 While global markets navigate war and fractured supply chains, India’s "Make in India" tailwinds and PLI schemes offer a massive, multi-year domestic runway for Syrma.
🔸 Scale as a Weapon: With a robust order book standing at ₹6,400 Cr, Syrma’s massive execution machinery allows it to defend its market share and outpace smaller players through sheer size and strategic JVs.
📈 Chart Structure & Key Levels
🔸 The stock has been caught in a fierce macro-driven downdraft, recently experiencing a sharp 12% gap-down on heavy volumes.
🔸 Immediate Support: The ₹720 to ₹740 zone (recent panic lows) now acts as a critical demand zone.
🔸 Immediate Resistance: The stock needs to decisively reclaim the psychological ₹800 to ₹820 supply zone to break the current sequence of lower highs.
🔸 Moving Averages: The price action reflects the broader EMS correction, currently trading below its 50-DMA (₹793) as the market digests the geopolitical premium.
🎯 The Bottom Line
🔹 Syrma is positioning itself as a high-growth structural play on India's electronics manufacturing boom.
🔹 The stock could be a direct beneficiary from Atmanirbhar Bharat tailwinds.
Tweet for educational purposes only.
No Reco.
@DhawalDoshi5 @TrendSpark420

HDFC Bank: The Fortress Balance Sheet Amidst the Middle East Oil Shock
Context: While the escalating Iran war sends shockwaves through global markets, HDFC Bank remains a defensive anchor, currently trading around the ₹870 mark amidst broad-based FII selling.
🏦 Q3 Earnings: Resilience in a Tight Environment
🔸 The NII Engine: HDFC Bank delivered a steady Q3 FY26, with Net Interest Income (NII) growing 6.3% YoY to ₹32,615 Cr, backed by disciplined pricing.
🔸 Profitability Check: Net profit jumped 11.5% YoY to ₹18,654 Cr. The growth was heavily supported by a sharp decline in provisions, proving their risk management remains top-tier.
🔸 The Margin Reality: Core Net Interest Margins (NIM) have stabilized at 3.35%. The worst of the funding cost pressures seems priced in, though elevated deposit rates remain a hurdle.
🔸 Asset Quality: Gross NPAs hold steady at 1.24%, showcasing extreme prudence in loan book expansion.
🌍 The Macro Crucible (Iran War & The Crude Oil Threat)
🔸 The Brent Crude Red Flag: With the US-Iran conflict escalating, Brent crude threatening the $100 per barrel mark flashes a glaring red flag for the broader Indian macro-economy and the banking sector.
🔸 Currency & Liquidity Squeeze: The oil spike has pushed the Rupee to record lows. This imported inflation threatens to keep RBI rates higher for longer, directly impacting bank credit growth and the cost of funds.
🔸 FII Flight: Emerging markets are facing a severe risk-off environment. As a highly liquid, heavily foreign-owned stock, HDFC Bank is bearing the brunt of the immediate geopolitical panic selling.
🌉 Thematic Bridge (Structural Credit vs Global Fragility)
🔸 While global markets navigate war and fractured supply chains, India’s under-penetrated credit market offers a massive, multi-year domestic runway for HDFC Bank.
🔸 Scale as a Weapon: In a liquidity-tight, inflationary environment, smaller banks get squeezed. HDFC Bank’s massive deposit-gathering machine allows it to defend its margins and dominate market share through sheer size.
📈 Chart Structure & Key Levels
🔸 The stock has been caught in a fierce macro-driven downdraft, breaking below its near-term moving averages on heavy volumes.
🔸 Immediate Support: The ₹835 to ₹850 zone (recent 52-week lows) now acts as a critical demand zone. A dip here often finds deep-pocketed institutional interest.
🔸 Immediate Resistance: The stock needs to decisively reclaim the psychological ₹900 to ₹920 supply zone to break the current sequence of lower highs.
🔸 Moving Averages: The price action reflects the broader market pain, currently trading below the 50-DMA and 200-DMA as the market digests the geopolitical premium.
🎯 The Bottom Line
🔹 HDFC Bank is positioning itself as a defensive play on India's financial resilience.
🔹 The stock demands conviction from investors who believe strong domestic underwriting can outlast the severe headwinds of the Iran conflict and an elevated oil import bill.
Tweet for educational purposes only.
No Reco.
@DhawalDoshi5 @TrendSpark420

5
13
14,447
PolyCab: Powering the Infra Boom amidst Global Supply Shocks
Context: The Indian Cables & Wires giant is riding a massive domestic capex wave. While global supply chains face extreme turbulence from geopolitical conflicts, Polycab has emerged as the alpha in the FMEG space, recently hitting fresh all-time highs and currently trading near the ₹8,540 mark.
🏭 Q3 Earnings: A Tale of Topline Dominance
🔸 The Revenue Explosion: Polycab delivered a blockbuster Q3 FY26 with consolidated revenue surging 46% YoY to ₹7,636 Cr, obliterating market estimates.
🔸 Profitability Check: PAT jumped an impressive 36% YoY to ₹630 Cr, proving the core business engine (especially the domestic W&C segment) is firing on all cylinders.
🔸 The Margin Reality: Despite the massive top-line beat, EBITDA margins saw a slight compression (down 110 bps to 12.7%), reflecting evolving cost dynamics and raw material pressures.
🔸 FMEG Scale-Up: The Fast-Moving Electrical Goods segment is showing steady growth (up 17% YoY), slowly validating the company's long-term transition from a pure B2B cable player to a broader B2C electrical brand.
🌍 The Geopolitical Crucible (War & Supply Chain)
🔸 The Red Sea Chokepoint: With merchant ships forced to reroute due to the ongoing Middle East conflict, export timelines have stretched by 10-15 days, instantly jacking up ocean freight costs.
🔸 Export Headwinds: The share of export revenues has taken a hit as global macros remain fragile, forcing the company to lean even heavier on its domestic demand engine.
🔸 Commodity & Energy Inflation: The broader war scenario adds extreme volatility to core inputs like Copper and Aluminum, much like how elevated Brent crude pressures the wider industrial sector. The key test remains Polycab's pricing power to pass these costs to the consumer.
🏗️ Thematic Bridge (Domestic Capex vs Global Fragility)
🔸 While global markets navigate recessionary fears and fractured supply chains, India’s structural thrust on power grids, real estate, and renewables offers a massive, multi-year domestic moat for Polycab.
🔸 Scale as a Weapon: In an inflationary, war-torn macro environment, smaller unorganized players get squeezed out. Polycab’s massive ₹3,000+ Cr net cash pile allows it to dominate market share through sheer balance sheet strength.
📈 Chart Structure & Key Levels
🔸 The stock recently shattered a 4-month consolidation phase, registering a massive technical breakout backed by heavy delivery volumes.
🔸 Immediate Support: The previous breakout zone around ₹7,900 to ₹8,000 now acts as a formidable base. A dip here is likely to find strong institutional buying interest.
🔸 Immediate Resistance: The stock needs to decisively clear the psychological ₹9,000 mark to initiate the next major leg of the primary uptrend.
🔸 Moving Averages: Unapologetically bullish. The price action is trading well above its 50, 100, and 200-DMAs, confirming that bulls remain in absolute control.
🎯 The Bottom Line
🔹 Polycab is no longer just a proxy for housing; it is a leveraged play on India's entire electrification and infrastructure super-cycle.
🔹 The stock demands conviction from investors who believe strong domestic execution can outpace the headwinds of global geopolitical fractures and commodity inflation.
Tweet for educational purposes only.
No Reco.
@DhawalDoshi5 @TrendSpark420

5
11
2,855
TCS: Navigating the GenAI Disruption & The US-India AI Bridge
Context: The Indian IT bellwether is at a historic crossroads. With the Nifty IT index facing a brutal correction due to the explosive rise of autonomous AI agents, TCS is fighting to transition from a legacy outsourcer to an AI-first enterprise. It is currently trading near the ₹2,640 mark.
🤖 The AI Disruption: Threat or Catalyst?
🔸 The Claude Code Shockwave: Anthropic’s massive valuation and the launch of AI agents capable of modernizing legacy code and automating compliance have directly challenged the traditional Indian IT moat.
🔸 Death of "Time & Material": The classic billing model is under siege. As AI plugins handle repetitive coding and testing, TCS is being forced into a structural reset toward outcome-based, margin-accretive pricing.
🔸 Thematic Bridge (AI in India vs US): While US hyperscalers and startups build the foundational models, the actual enterprise integration, data governance, and scaling remain the domain of execution engines like TCS.
🔸 Cannibalizing for Survival: Management is actively mandating employees to use AI to build better, faster solutions (openly accepting short-term revenue cannibalization to secure long-term relevance).
📊 Fundamental Catalysts
🔸 Margin Resilience: Despite the sector-wide AI panic, TCS strives to maintain its operating margins, proving its ability to optimize the talent pyramid even as required skill sets shift dramatically.
🔸 Mega Deal Pipeline: Multi-billion dollar TCV wins continue, showing that while AI handles the micro-tasks, Fortune 500 boards still trust TCS to manage their complex macro digital infrastructure.
🔸 War Chest: Massive free cash flow generation provides the capital needed to heavily invest in internal AI upskilling and potential niche AI acquisitions.
⚠️ Sector & Execution Headwinds
🔸 The Transition Gap: The market is repricing the sector based on fear. The gap between losing traditional outsourcing revenues to AI automation and gaining new revenues from AI consulting is the biggest near-term structural risk.
🔸 Talent Evolution: The ongoing battle is no longer just about hiring volume, but about rapidly reskilling a massive workforce to operate alongside AI copilots without losing operational efficiency.
📈 Chart Structure & Key Levels
🔸 The stock is currently in a severe downtrend, absorbing the massive sector-wide AI sell-off and attempting to build a base after hitting a fresh 52-week low.
🔸 Immediate Support: The recent low near ₹2,560 acts as the ultimate line in the sand. A decisive breakdown here signals deeper structural capitulation to the AI threat narrative.
🔸 Immediate Resistance: Needs to decisively reclaim the ₹2,700 to ₹2,750 supply zone on heavy delivery volumes to initiate a relief rally and prove the "AI Doomsday" fears are overextended.
🔸 Moving Averages: The price action remains technically weak, with the stock trading well below its 50, 100, and 200-DMAs, indicating that bears remain in firm control.
🎯 The Bottom Line
🔹 TCS is no longer just a defensive tech play; it is the ultimate proxy for how Indian IT adapts to the US-led GenAI revolution.
🔹 The stock demands patience from investors betting that human-led enterprise execution and governance will survive the age of autonomous AI agents.
Tweet for educational purposes only.
No Reco.
@DhawalDoshi5 @TrendSpark420

2
10
13,401
Multi Commodity Exchange (MCX): Strategic Moat & Future Roadmap
Context: The undisputed monopoly of Indian commodity derivatives is trading near the ₹2,405 mark, consolidating below its post-split 52-week high of ₹2,705 after delivering a blockbuster quarterly earnings report.
🏰 The Exchange Engine: Monopoly & Operating Leverage
🔸 Near-Absolute Monopoly: Dominating the Indian commodity derivatives market with virtually untouchable market share in precious metals and energy.
🔸 The Options Boom: Options premium turnover has skyrocketed, significantly outpacing futures and acting as the primary revenue growth engine.
🔸 Tech Transition Payoff: Successfully stabilized on the new software platform, shifting the narrative entirely from tech transition costs to pure operating leverage.
🔸 Product Innovation: Continuous launch of new contracts (like the BULLDEX monthly options) and dynamic adaptations to market volatility deepen the ecosystem.
🔸 Macro Tailwinds: Extreme volatility in global bullion (gold/silver) and energy markets acts as a permanent catalyst for robust trading volumes.
📊 Fundamental Catalysts
🔸 Q3 FY26 PAT delivered a massive 151% YoY surge to ₹401 Cr, proving the sheer profitability of its options-driven model.
🔸 Consolidated revenue jumped 121% YoY to ₹666 Cr, backed by explosive trading activity in the bullion segment.
🔸 Operating Leverage: Strict cost discipline post-software migration allowed revenue growth to flow straight to the bottom line, significantly expanding EBITDA margins.
⚠️ Sector & Execution Headwinds
🔸 Premium Valuations: Currently trading at a trailing P/E of ~65x. The market is pricing in perfection and sustained high volatility; any drop in trading volumes could trigger a sharp correction.
🔸 Regulatory Risks: Exchanges are heavily regulated and always susceptible to sudden SEBI changes regarding margin requirements or F&O retail participation.
🔸 Cyclicality of Volumes: The business model remains inherently tied to global commodity cycles; extended periods of sideways, quiet markets can dampen earnings.
📈 Chart Structure & Key Levels
🔸 The stock is currently digesting its recent 1:5 stock split and post-earnings rally, building a tight consolidation base in the ₹2,380-₹2,450 zone.
🔸 Immediate Support: ₹2,300 to ₹2,350. If this zone breaches, the next major downside cushion sits near the 50-DMA around the ₹2,290 level.
🔸 Immediate Resistance: Needs to decisively clear ₹2,485 on high volumes to challenge the lifetime high of ₹2,705 and enter a fresh price discovery phase.
🔸 The recent stock split has significantly increased retail liquidity and accessibility, fundamentally altering its short-term trading dynamics.
🎯 The Bottom Line
🔹 MCX remains the ultimate proxy for India’s financialization and trading boom, operating a highly scalable, asset-light monopoly.
🔹 The stock demands a premium, making it a classic "buy-on-dips" candidate for long-term portfolios looking for structural market infrastructure plays.
Tweet for educational purposes only.
No Reco.
@DhawalDoshi5 @TrendSpark420

4
10
8,795
Apollo Hospitals: Strategic Moat & Future Roadmap
Context: The undisputed leader of Indian healthcare is trading near the ₹7,695 mark, consolidating below its 52-week high of ₹8,099 after delivering a stellar quarterly earnings report.
🏥 The Healthcare Engine: Omnichannel Dominance
🔸 Integrated Ecosystem: Successfully evolving from a pure-play hospital chain into an integrated healthcare giant across physical hospitals, pharmacies, and digital health.
🔸 Core Hospitals (HCS): The primary cash cow with high occupancy rates (67%) and expanding EBITDA margins (24.8%), driven by complex case mixes and rising ARPOB.
🔸 Digital & Pharmacy Scaling: Apollo HealthCo (Pharmacy + Apollo 24/7) is rapidly scaling, contributing over ₹2,827 Cr in Q3 revenue with steadily improving profitability.
🔸 Strategic Acquisitions: The recent 100% buyout of Apollo Gleneagles PET-CT highlights a focus on tightening control over high-margin diagnostics and oncology.
🔸 Pan-India Expansion: Relentless physical expansion perfectly complements its digital footprint, creating a sticky, end-to-end patient moat.
📊 Fundamental Catalysts
🔸 Q3 FY26 PAT surged 35% YoY to ₹502 Cr, demonstrating strong pricing power and excellent cost-control discipline across verticals.
🔸 Consolidated revenue jumped 17% YoY to ₹6,477 Cr, backed by broad-based growth in core healthcare services and the lifestyle division.
🔸 Rewarding Shareholders: Declared a solid interim dividend of ₹10 per share, reinforcing its status as a reliable, cash-generating compounding machine.
⚠️ Sector & Execution Headwinds
🔸 Premium Valuations: Currently trading at a trailing P/E of ~61x. The market is pricing in perfection, meaning any future earnings miss could trigger a sharp correction.
🔸 Digital Cash Burn: While narrowing, the operational and ESOP costs associated with scaling the Apollo 24/7 platform still act as a slight drag on overall consolidated margins.
🔸 Increasing Competition: Aggressive metro expansions by deep-pocketed peers could pressure market share and regional pricing power over the long term.
📉 Chart Structure & Key Levels
🔸 The stock is currently digesting its post-earnings rally, building a tight consolidation base in the ₹7,600-₹7,700 zone.
🔸 Immediate Support: ₹7,550 to ₹7,600. If this zone breaches, the next major downside cushion sits near the ₹7,450 level.
🔸 Immediate Resistance: Needs to decisively clear ₹7,750 on high volumes to challenge the lifetime high of ₹8,099 and enter a fresh price discovery phase.
🔸 Recent derivatives data shows a significant surge in Open Interest (OI) with fresh contracts, hinting that traders are positioning for an impending directional move.
🎯 The Bottom Line
🔹 Apollo Hospitals remains the gold standard proxy for India’s structural healthcare boom, boasting an unmatched omnichannel network.
🔹 The stock demands a premium, making it a classic "buy-on-dips" candidate for long-term portfolios rather than a deep-value play.
Tweet for educational purposes only.
No Reco.
@DhawalDoshi5 @TrendSpark420

IDFC First Bank: Current Status & Future Outlook
Context: The retail-first banking franchise is consolidating just below its 52-week highs (₹87 down to ~₹83.50) amidst strong business momentum and recent headline noise.
🏦 The Business Engine: Transforming the Core
🔸 Retail Transformation: Successfully transitioned from a wholesale infra-lender to a retail-heavy powerhouse, with retail deposits now constituting 79% of total customer deposits.
🔸 CASA Moat: Industry-leading CASA ratio of 51.64%, driven by attractive savings rates and a rapidly expanding network (now 1,066+ branches).
🔸 Digital Tech Stack: Heavy investments in digital onboarding, credit cards (4.3 million in force), and wealth management (assets up a stellar 31% YoY).
🔸 Diversified Credit: Granular loan book heavily skewed towards mortgages, vehicles, and consumer tech, de-risking the legacy corporate NPA drag.
🔸 Lowering Cost of Funds: Cost of funds has significantly cooled to 6.11% (from a 7.8% peak), aligning closer to mid-tier peers and aiding future margin expansion.
🚀 Fundamental Tailwinds
🔸 Q3 FY26 Net PAT skyrocketed 48% YoY to ₹503 Cr on the back of healthy core income and strict execution discipline.
🔸 Spectacular balance sheet growth with Customer Deposits up 24% YoY (₹2.82 Lakh Cr) and Loans & Advances up 21% YoY (₹2.79 Lakh Cr).
🔸 Asset quality continues its structural improvement: Gross NPA dropped to 1.69% (down 25 bps YoY) while Net NPA stabilized at a clean 0.53%.
🚨 Fundamental Headwinds
🔸 Recent Headline Risk: A newly reported ₹590 Cr suspected fraud involving state government-linked accounts at a Chandigarh branch creates near-term regulatory overhang.
🔸 Macro Sensitivity: As with the broader Indian banking space, any systemic shocks (e.g. Brent Crude surging back above the $100 mark) remain a persistent threat to liquidity and industry margins.
🔸 Operating Leverage & MFI: High OPEX due to rapid branch expansion and historical micro-finance (MFI) vulnerability keeps the cost-to-income ratio elevated compared to larger private peers.
📈 The Price Action & Technicals
🔸 Currently consolidating and building a tight base in the ₹82-₹85 zone, digesting recent earnings and news flow.
🔸 Immediate Support: ₹82.90 (near the 50-DMA). A breakdown below this could see it drop towards 100-DMA hovering around ₹80.60.
🔸 Immediate Resistance: Needs a strong weekly close > ₹85 to challenge the 52-week high at ₹87 and break into positive sentiment territory.
🔸 Indicators show price action is range-bound and near exhaustion, awaiting a decisive volume breakout to resume the broader long-term uptrend.
💡 Final Takeaway
🔹 IDFC First is transitioning from a turnaround story into a stable, compounding retail machine, provided it swiftly navigates recent operational hiccups.
🔹 The risk/reward remains moderately favorable for staggered monthly accumulation, assuming the long-term Indian credit growth narrative holds intact.
Tweet for educational purposes only.
No Reco.
@DhawalDoshi5 @TrendSpark420

Data Patterns: Current Status & Future Estimates
Context: The defense electronics powerhouse has entered a period of consolidation following the broader sector's massive multi-year rally.
🏗️ The Business Engine: Indigenous Defense Tech
🔸 Vertical Integration: One of the few Indian players offering end-to-end capabilities, from in-house design and R&D to the manufacturing of complete aerospace and defense systems.
🔸 Radar & Electronic Warfare (EW): A dominant supplier of critical sub-systems for early warning radars, missile seekers, and advanced EW suites for both naval vessels and fighter jets.
🔸 Aerospace & Avionics: Deeply integrated into key platforms like the LCA Tejas and indigenous helicopters, providing advanced flight control computers and cockpit displays.
🔸 Space & Missiles: A key contributor to the BrahMos program (launch and fire control systems) and actively expanding into small satellites and ISRO-aligned space tech.
🔸 High-Value IP: Moving beyond built-to-print manufacturing into complete built-to-spec system design, giving them ownership of highly lucrative intellectual property.
🟢 The Fundamental Bull Case
🔸 Massive structural tailwinds from the Ministry of Defence's import embargo lists and the ongoing 'Make in India' defense indigenization push.
🔸 Industry-leading margin profile (historically maintaining 35%+ EBITDA margins) driven by their high value-add design and R&D focus.
🔸 A robust, high-visibility order book filled with single-vendor contracts and recurring production orders.
🚩 The Fundamental Red Flags
🔸 Revenue Lumpiness: Performance is heavily tethered to government procurement cycles, testing schedules, and DPSU timelines, causing major quarter-to-quarter volatility.
🔸 Working Capital Heavy: Elevated receivables and long cash-conversion cycles are a structural reality when dealing predominantly with the government.
🔸 Priced for Growth: Valuations remain steep at a trailing P/E of ~66x, meaning any execution delay or margin compression will be heavily punished by the market.
📉 The Technical Chart Story
🔸 Currently trading near ₹2,984, actively navigating the ₹2,850-₹3,150 zone after catching a recent tailwind from the Indo-French Rafale co-production news.
🔸 Immediate Support: ₹2,770. (A breakdown below this risks a deeper correction toward the 200-DMA at ₹2,721).
🔸 Immediate Resistance: Needs a strong weekly close > ₹3,270 (clearing its 52-week high of ₹3,268) to break out into blue-sky territory.
🔸 Daily RSI sits at ~63, showing healthy bullish momentum is building without yet pushing into overbought exhaustion.
🎯 Verdict
🔹 Data Patterns remains a high-conviction play on Indian defense intellectual property, currently digesting its past gains in a healthy consolidation phase.
🔹 The risk/reward favors patient capital willing to tolerate quarterly lumpiness to ride the multi-year Atmanirbhar Bharat defense supercycle.
Tweet for educational purposes only.
No Reco.
@DhawalDoshi5 @TrendSpark420

7
13
11,047
Vishnu Pradeep retweeted

I’ve started teaching the markets for FREE on my Telegram - and the response has been incredible 🙌
We’ve already completed 2 structured classes, and this is just the beginning. If you truly want to understand price action, structure, risk management, and how to think independently in markets, you should be inside.
Attached below are a few screenshots of what we’re learning.
Inside the group, you will get 👇
1. Structured market classes
2. Study charts & live market structure breakdowns
3. Stock-specific analysis
4. Indicator knowledge in simple, practical language
5. Selected trades (for learning + execution understanding)
All free. Just real market education.
Many more classes are coming.
If you want to grow with us, join through the link below or comment, and I’ll help you get in 👇
t.me/Microcap10X


Transrail Lighting: Current Status & Future Outlook
Context: The power T&D giant has taken a 33% haircut from its post-IPO 52-week highs (₹855 down to ₹568).
🏗️ The EPC Engine: Beyond Basic Towers
🔸 Grid Modernization: Heavy focus on the domestic power transmission boom, constructing massive 765 kV double-circuit lines (like the recent Khetri-Narela project).
🔸 Backward Integration: In-house manufacturing of towers, poles, and conductors, which protects supply chains and boosts operating margins.
🔸 Going Global: Aggressively expanding its international footprint into the MENA region, Abu Dhabi, Tunisia, and Djibouti.
🔸 Diversified EPC: Expanding past traditional T&D into high-growth verticals like Civil Construction, Railways, and Solar EPC.
🔸 Sticky Moats: Over four decades of execution experience with a presence in 60+ countries and deep pre-qualification moats in complex infrastructure.
🟢 The Fundamental Bull Case
🔸 Massive ₹18,216 Cr order book (including L1) and recent ₹2,350 Cr wins provide immense, multi-year revenue visibility.
🔸 Q3 FY26 Operating PAT grew a stellar 36% YoY to ₹127 Cr on the back of 32% top-line revenue growth.
🔸 EBITDA margins remain healthy at 12.7%, improving 77 bps sequentially due to execution discipline and operating leverage.
🚩 The Fundamental Red Flags
🔸 High working capital intensity and debt levels inherent to the heavy EPC business model (Total borrowings ~₹660 Cr).
🔸 EBITDA margins saw a slight YoY compression (from 13.2% down to 12.7%) despite the recent QoQ improvement.
🔸 Regulatory headwinds: Recently had to take a ₹17 Cr exceptional hit to profits due to provisions for the new labor code.
📉 The Technical Chart Story
🔸 Currently consolidating and building a base in the ₹560–₹590 zone.
🔸 Immediate Support: ₹540 (near the 50-DMA). A breakdown below this opens the trapdoor to the ₹400 post-IPO lows.
🔸 Immediate Resistance: Needs a strong weekly close > ₹600 to break the immediate lower-high structure, with the 200-DMA lurking at ₹652.
🔸 RSI and MACD crossovers show the fierce post-IPO bearish momentum is finally reaching exhaustion.
🎯 Verdict
🔹 Transrail is transitioning from a sharp post-listing hype correction into a critical, range-bound accumulation phase.
🔹 The risk/reward is highly favorable if you back the long-term Indian Power T&D and infrastructure capex narrative.
Tweet for educational purposes only.
No Reco.
@DhawalDoshi5 @TrendSpark420
