

Master of Trading | Chart Sniper | Teaching Technical Analysis (ICT + RTM) | $BTC Enthusiast | Business Development
Joined November 2021
- Tweets3.4K
- Following4K
- Followers1.2K
- Likes5.2K







CrystalBTC retweeted

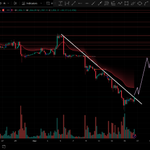
$BTC In 2022, the market bottomed on the 21st of November so this is exactly 4 years ago now.
News lows made, putting the total bear market duration at 400+ days now.
4 Cycle theory has always been a strong guideline for this market and it has proven itself pretty accurate yet again.
But while the dates line up pretty well, the percentages and moves have not. 2025 closed red and this year likely will too. Never before has Bitcoin closed 2 consecutive years in the red.
This would also be the smallest bear market drawdown by far if it were to bottom in the $50K region. But that is a trend we've already been seeing a long time. Both the ups and the downs are getting smaller with every cycle.


CrystalBTC retweeted

Longest BTC bear in history was 411 days, 3 cycles ago.
Current one just hit 410.


CrystalBTC retweeted

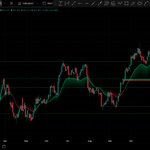
Seeing lots of fuzz about structure in crypto but if anything the market has been ranging for the majority part of the year, after the early year macro uptrend break.
Right now, it is at this 2026 range low with deeply oversold market, that has been previously bouncing from this region.
Would expect something similar over the next weeks to a month.
Macro bias remains bearish but locally leaning on the bull side.
Find out full breakdown in the Monday J'Nest!


CrystalBTC retweeted
$BTC With how this has been trading I am pretty confident of my previous statement that there's likely been one or more major whales offloading billions of Bitcoin at a rapid pace.
(Yes I know this might be stating the obvious as clearly we had a lot of selling after such a move. The point I want to make is that it is likely some large unknown seller(s) that have been dumping BTC specifically).
Some things I'm seeing:
1. Funding has remained at its highs regardless of the "down only" price action.
2. The Coinbase discount has been at multi year lows for several weeks.
3. Shorts have been hammering price and have not been punished much.
4. Price has been completely ignoring any big up days in the stock market.
5. The past few days especially we've seen some majors have hold up better than BTC. This rarely happens during large corrections unless there's some major selling of BTC specifically going on.
If I had to guess, this sudden selling now comes from the fear of some major hack or exploit happening in the future. It is no secret that we're seeing a lot of that right now due to AI. For many (long term) investors it doesn't feel "safe" anymore to just hold your coins in your wallet. Whether it's exploits or quantum in the future, things don't feel as comfy as they were.
Obviously this is all just speculation from my side and it's not like we can do a lot with it at this point after the move has happened. The best you can do is watch for the Coinbase discount to slowly diminish from here on out and for funding rates to turn back down. That would indicate spot selling has stalled.
I also think that would be the cue for a lot of swing shorts that have been milking this move down from higher to start taking profit which should see the Open Interest come down a bit. Good game to those guys because that was an amazing trade.
As mentioned yesterday, the most scary down moves are the ones where there's no direct narrative or reason as to why. Often in hindsight we figure out that it was simply some large player offloading billions in coins. The market is still small enough for single large entities to have such an impact.


The scariest dumps are the ones where there's no obvious catalyst.
$BTC has been trading as if some entity is selling off billions on spot (outside of ETFs) lately.
Maybe we'll hear about something in the future, maybe not.
And yes, there's plenty of arguments to be made why we're going down but a lot of it is just trying to fit the price action to something. Fact is, nothing that's happening now "deserves" this kind of relentless sell off.
So there's some big players at work behind the scenes the past few weeks. Good thing is that when it does stop price will also magically start going up without a catalyst. Now we just need patience.


CrystalBTC retweeted
Head and Shoulders (Bearish Reversal)
A Head and Shoulders pattern marks an uptrend losing momentum and reversing downward. It features a higher central peak (the head) between two lower peaks (the shoulders), resting on a baseline support level called the neckline.
The setup confirms when price breaks below the neckline on expanding volume. The projected downward move roughly matches the distance from the head to the neckline, measured down from the breakout level.
🤝 Paid partnership

CrystalBTC retweeted

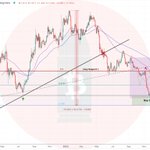
Bitcoin is continuing to unwind
It is set to record a new daily low candle close in this retrace
This is also seeing Bitcoin finally fill in the big void in price it left behind in the August rally
If momentum continues down, a backtest of previous resistance, testing for a flip to support at $68,000, remains a possibility

CrystalBTC retweeted

#BTC
Throughout all major 2026 Bitcoin pullbacks, the final capitulation Weekly Candles would range from -24% downside in February to -20% in June
But there's evidence of shallowing in these capitulatory Weekly candles
Could Bitcoin's next sell-side capitulation take place on a shallower Weekly candle that is less than -20%?
$BTC #Bitcoin

CrystalBTC retweeted
Bitcoin is struggling to find a floor.
We've now lost the $76,400 support level, which had been holding the market together.
BTC is trading around $73,560, with the 4H chart continuing to print lower highs and lower lows.
The next thing I want to see is whether buyers can defend the recent $73K region.
A reclaim of $76,400 would be the first meaningful sign of strength.
Until then, the bears have the upper hand.

CrystalBTC retweeted

$BTC is sitting in a zone that has only been seen 3 times before.
Each time, the dip was the opportunity.

CrystalBTC retweeted
$BTC Holding on to the $75.5K support after that massive flush which swept the September low.
Above, that $81K level has been important. Main level for the bulls to break to get the momentum back.

CrystalBTC retweeted

Stellar keeps collecting tokenized funds and payment volume because it was designed around cross-border transfers from the start. Compliance features and low costs make it practical for institutions that want stablecoin and asset movement without drama. $XLM
CrystalBTC retweeted
$BTC is sitting between two liquidity boxes. Top one around 83k, bottom one around 78k.
I want the sweep of the top first. Weak reaction there and I’m looking short toward the 75k to 77k demand zone. Close above 84.7k and I’m wrong.
15,000 USDT!
phemex.com/rewards-hub?group…
#BTC
🤝 Paid partnership
