

Gold charts & market data analyst. Lifelong obsession with charts. Searching all charts nautical & golden for that pot of gold.
DownUnder
Joined April 2025
- Tweets7.2K
- Following880
- Followers13.2K
- Likes304




Pinned Tweet
All these charts and 1000's more available on my website goldchartsrus.com for the price of a coffee. Over 75,000 charts on 8,500 pages dedicated to gold, precious metals & financial markets.
The website is old school built in php/html on notepad & an old XP box. It is not HTTPS but is entirely safe to use. It will never be updated nor replaced & you will find many charts here that you won't find anywhere else on the web. The website has been designed around online databases updated intraday/dailyweekly/monthly that allow all the 1000's of charts to update.
It shows one man's obsession with gold & historical data & the ability to write charts in code to show unique insights.
With so many charts to view you will find out why I perceive charts as golden conveyors of information.
A picture is worth a thousand words & a charts shows a lifetime of prices.


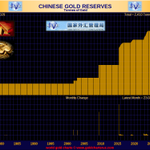
1999 & China hadn't really started accumulating gold.
2008 was the real trigger.


As usual gold bogs are disconnected from reality. In July 1999 gold had been in a 20 year bear market with a monthly RSI at 27 and was the most hated risk asset. Now it's only 9 months into an early stage bear market coming off the highest RSI in history.
xitter.cf/DonDurrett/status/2114…

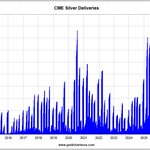
Silver deliveries & the October contract


#AG_IssuesandStops for 10/26 has 101 new Delivery Notices (505,000 oz.) and 3,682 since 1st Intent Day (18,410,000 oz.)
Customer Accounts are dominating the Notices this contract at a 2-1 ratio and have Stopped 254 more than Issued (1,270,000 oz.) #comex #silver


GoldFish Charts retweeted

Never forget...
Gold moves in cycles...


Gold Heading into 2-Year Cycle Bottom!
Minimum target $8’800...
... and 5 Gold Miners to Own
Read here: arvymacrocycles.substack.com…

GoldFish Charts retweeted

Gold has a habit of shaking out investors just before its next big move.
After two strong years, our 2026 Outlook called for a correction and a position washout.
That is what we got. Now our projected cycle low is approaching.


Gold Moves
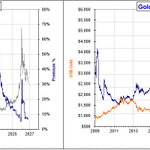
Are we with chart A or chart B?
One can readily paint a case using the 2000 to 2011 run that we have just replicated it again & this move is over.
But that's just charting.
On the global front all the reasons are there for it to move higher.
That the fundamentals trump the charting technicals in what is a manipulated market
We are 10% from the bottom with 5X upside long term.
So these short term moves don't do much except to consume time.
Patience


Are we talking disclosed reserves with no audits or how much is in the country held by the people?
Per capita they are catching up nicely.


china's money supply is twice america's. it holds less than a third of the gold.
america's gold covers about 4% of its M2. china's covers less than 1%.
to back the yuan the way america backs the dollar, gold would need to be about $31,000 an ounce. roughly 8x today's price.
beijing doesn't back the yuan with gold. it backs it with a closed capital account.
According to the World Gold Council, about 216,000 to 220,000 tonnes of gold have been mined over all of human history.
This stated gold is the official measured mined gold - from statistics shown.
What is not included is the local regional artisanal gold miners production.
Estimates vary but presumption is approx 10% additional.


𝗪𝗛𝗘𝗥𝗘 𝗗𝗜𝗗 𝗧𝗛𝗘 𝗚𝗢𝗟𝗗 𝗚𝗢?
━━━━━━━━━━━━━━━━━━
Gold is one of the rare assets where we can make a reasonable estimate of total supply. According to the World Gold Council, about 216,000 to 220,000 tonnes of gold have been mined over all of human history. Because gold does not rust, decay, or disappear, almost all of it still exists today, locked away as jewelry, bars, coins, or official reserves.
Each year, global mining adds only 3,000–3,500 tonnes, about 1 to 1.5 percent of the existing stock. In practical terms, gold is almost a closed system. What matters is not how much is produced, but who absorbs it and whether it ever comes back to the market.
That leads to a simple but powerful rule: whoever steadily buys gold and does not sell it eventually gains control over the system, even if they do so quietly.
Gold production today is concentrated in a small group of countries. China has been the world’s largest producer since 2007, mining roughly 350–400 tonnes a year. Russia, Australia, South Africa, and a few others follow. But production alone does not explain what has happened to the global gold stock. The real story begins after the gold leaves the mine.
This is where China becomes central and where global perception lags reality.
━━━━━━━━━━━━━━━━━━
Gold is unlike most commodities because it has a buyer with unlimited patience: central banks. Central banks do not trade gold. They accumulate it and store it. Once gold enters a central bank vault, it effectively disappears from the active trading market. As of 2024, central banks officially hold about 37,000 tonnes of gold, roughly 17 percent of all gold ever mined.
Official rankings suggest the United States dominates this landscape, reporting 8,133 tonnes the largest declared reserve by far. China, by contrast, officially reports only about 2,300 tonnes. On paper, the gap looks enormous.
But paper is exactly the issue.
Americans now claim ownership of roughly 40 percent of all bitcoins ever mined, while China controls close to 20 percent of all the gold ever extracted from the earth. The contrast is not cultural or technological; it is structural.
One system maximized financial abstraction and mistook liquidity for control. The other accumulated physical finality.
Digital assets depend on continuous operation markets, power, networks, and law. Gold depends on none of these. When systems compress, accounting claims lose priority and custody asserts itself.
What matters then is not who maintains the ledger, but who holds the asset that settles without permission.
The United States last conducted a full audit of its gold reserves in the 1950s. Since then, the reported number has barely changed, despite enormous changes in the global monetary system. The figure may be accurate, but it rests largely on trust.
China operates differently.
━━━━━━━━━━━━━━━━━━
Start with domestic production. Over the past two decades, China has mined roughly 7,000–8,000 tonnes of gold. Chinese law prohibits the export of domestically produced gold. Once it is mined, it stays inside the country. That fact alone puts China’s internal gold stock well above its officially reported reserves.
Next come imports. Since the 2008 financial crisis, China has been a steady buyer of gold through global hubs such as London and, most visibly, Switzerland. Swiss customs data show thousands of tonnes of gold flowing east over the past decade. Much of this gold is recast into 1-kilogram bars, the format preferred by Chinese banks and institutions. Analysts who track refinery output and bar flows estimate that 4,000–5,000 tonnes have moved east this way alone.
Then there are bilateral and off-market transactions. China has accepted gold as payment for goods and infrastructure from countries facing sanctions or dollar shortages, such as Iran. It has also reportedly received gold directly or indirectly through energy and weapons trade with Russia. These deals rarely pass through transparent markets and are not captured in official reserve statistics.
Finally, there is domestic absorption. Chinese households are among the largest gold buyers in the world, using gold jewelry and bullion as a parallel savings system. At the same time, state-owned banks, policy banks, and state enterprises hold physical gold on their balance sheets under categories like “bullion” or “precious metals.” These holdings do not appear in central-bank reserve data reported to the IMF.
Put all of this together domestic mining, Swiss imports, sovereign transactions, gold-for-goods trade, institutional holdings, and household ownership and a very different picture emerges.
Conservative estimates suggest China controls more than 15,000 tonnes of gold. Less conservative, but still plausible, estimates place the number closer to 25,000 tonnes. Including private holdings, China may effectively control over 20 percent of all the gold ever mined on Earth.
Not officially. Not transparently. But functionally.
━━━━━━━━━━━━━━━━━━
And unlike Western gold, much of this metal is immobile. It is not sitting in ETFs. It is not lent into the market. It does not circulate through bullion banks. It is held quietly, patiently, and strategically.
The rest of the world, meanwhile, behaves like a pigeon in front of a cat eyes shut, hoping nothing changes.
Yet the implications are profound. A country that can stare down the United States in trade wars, dominate rare-earth supply chains, and still hold enough gold to potentially back a large share of its currency presents a deeply unsettling scenario for the global financial system.
Something has already changed.
For the first time since the age of imperial treasure fleets, since the era of Zheng He, China has accumulated a share of the world’s ultimate monetary asset that rivals historic empires.
Not to signal power. Not to trade. But to insulate itself and wait.
Gold hasn’t vanished.
It has simply moved east and it is unlikely to return anytime soon.

GoldFish Charts retweeted

I'm firmly back in the gold bull camp. Rome wasn't built in a day, and the uptrend won't resume overnight. Prices may fall further first, but I believe the period from now through year-end will ultimately be seen as an excellent buying opportunity in metals, mining, and exploration stocks.


There is a massive GAP between gold demand and gold prices:
Physical-gold backed ETFs tracked by Bloomberg have recorded 14 consecutive WEEKS of inflows. $GLD
This has brought gold ETF holdings to nearly 102 million troy ounces, their highest level since mid-2022.
However, over the same period, gold prices have declined -1%, after rising as much as +16% before falling -14% from their local highs. $GLDM
Long-term gold investors appear to be taking advantage of this accumulation opportunity to hedge against fiscal uncertainty, geopolitical tensions, and the constant erosion of currency purchasing power.
At the same time, short-term gold price movements reflect interest-rate expectations shaped by oil prices and FX movements, as well as technical factors.
Smart money is accumulating gold at a historic pace.

GoldFish Charts retweeted

🇺🇸 US industry uses about 3.5 times more silver than US mines dig up.
📊 2025, million ounces (Silver Institute / Metals Focus):
• Silver used by US industry: 125.5
• Silver mined in the US: 35.7
The rest has to come from imports and recycled metal. That gap is part of why silver joined the US critical minerals list in Nov 2025.
⛏️ Who mines it here? The biggest US silver mine is Hecla's Greens Creek in Alaska, at 8.7M oz last year. Coeur's Rochester in Nevada made 6.1M oz, up 40%.
⚖️ Yes, but: new US mines take years. Permits, studies and money all come first.
👀 Next: Coeur reports its Q3 on Wed Nov 4.
$XAG #XAG $HL $CDE
Source: silverinstitute.org/wp-conte…
NFA · @dailyprintx · #DailyPrintDesk


GoldFish Charts retweeted

First, read Ann Vandersteel's piece, and then read mine.
Then let's have a discussion in the replies about future U.S. monetary systems. Will the USD endure in any form, in a multi-polar world where the USA has alienated half of the planet with wars and sanctions?
xitter.cf/annvandersteel/status/…
@annvandersteel @HealthRanger

Time to load up on silver, particularly silver coins and even "junk 90." During the coming fiat USD collapse, there will be an attempt to substitute some new form of digital fiat. This may or may not work in the long term, but there is sure to be a period where the USD is dead and legally ordered "stablecoins" have not restarted the economy. During this period, you will want to have some hard currency, that is, gold and silver coinage.
Barter is too clumsy, and requires multi-player trades. ("I want food. I have a solar panel to sell, I don't need shirts, that guy has a jug of diesel, this other guy has a live goat to sell, but he doesn't need a solar panel, how can we make this work?") Silver coins allow for direct transactions. They are an immediately accepted medium of exchange.
Why not gold? The smallest useable gold coin is 1/10 of a troy ounce, smaller than a dime, and it's currently worth $400 USD. You can't "make change" with it at a pop-up swap market, and showing any gold coins will make you a target for violent thieves who may attempt to rob you or shadow you and plan a home invasion. Gold coins will be for major private purchases: vehicles, land, homes.
Today, silver is an industrial metal that is consumed in making solar panels and electronics, and you can't just "open up a new silver mine." It's a byproduct of other industrial mining, and as the world goes into a depression, industrial mining will slow.
So silver can only go up, long term. This week presents a historic buying opportunity. Any price under $60 is a major bargain. It could dip below $50, but we will see it over $100 again soon enough, and this time it's going to stay there. This may happen in the next year or in a few years, but it will happen.
I'm not saying sell everything to buy silver. But have enough coins to get your family through the chaos and confusion of the transition period from the fiat USD to whatever is going to come after and replace it. And one possibility is that "what comes after" fiat is a return to hard money, that is, gold and silver coinage.

GoldFish Charts retweeted

AMERICA ADDED DEBT WORTH 8.6% OF ALL THE GOLD HUMANITY HAS EVER MINED….
‼️In the last TWELVE MONTHS.
And people still wonder why governments abandoned the gold standard.
GoldFish Charts retweeted

Saving in US Dollars over the next 5 years will impoverish you. Saving in gold and silver ounces over the next 5 years will enrich you beyond the rate of inflation. Few understand this. Don't marry the money of the state.


GoldFish Charts retweeted

GOLD AND SILVER MINERS | Brutal Correction or the Destruction of the Bull Market? The Data Tell a Very Different Story.
I have conducted a quantitative study of 203 gold and silver mining companies, analyzing their performance from February 29, 2024, which I consider the beginning of the current bull market, through October 23, 2026.
The objective was to answer a particularly important question following the violent declines we have witnessed:
How many companies have actually given back all the gains accumulated during the bull market, and how many are still holding on to substantial profits?
To answer this question, I calculated three metrics for each company:
Cumulative return: The percentage change in price since the beginning of the bull market.
Maximum drawdown: The largest decline from a previous peak during the period analyzed.
Current drawdown: The percentage decline from the highest price recorded during the period to the most recent closing price.
The results are extraordinarily revealing.
1. THE OVERWHELMING MAJORITY OF MINERS ARE STILL SITTING ON SUBSTANTIAL GAINS
Of the 203 companies analyzed:
186 companies (91.6%) still show positive returns.
Only 17 companies (8.4%) are trading below their starting levels.
The median cumulative return stands at an impressive +209.67%.
Let's consider that last figure for a moment.
It means that the company at the midpoint of the distribution has seen its share price increase approximately 3.1-fold since February 2024, despite the magnitude of the subsequent correction.
2. THE CORRECTION HAS BEEN EXTRAORDINARILY VIOLENT
The drawdown figures reveal another equally important reality:
Median maximum drawdown: −50.22%.
Median current drawdown: −38.82%.
In other words, the typical company in the sample has experienced a decline of more than 50% from a previous peak at some point during the period and is currently trading almost 39% below its highest level over that period.
This helps explain why investor sentiment has become so negative.
However, there is a fundamental difference between losing 40% from the highs after a stock has multiplied several times in value and losing 40% relative to where it stood at the beginning of the bull market.
These are not equivalent situations.
A company can experience a devastating correction from its recent highs and still retain extraordinary cumulative gains.
3. THE DIFFERENCES BETWEEN INDIVIDUAL COMPANIES ARE ENORMOUS
Some miners have maintained spectacular returns since February 2024:
Benz Mining: +2,774%
Omai Gold Mines: +1,911%
Montage Gold: +1,785%
At the opposite end of the spectrum, we find companies that have not only surrendered all their previous gains but are now trading substantially below their initial levels.
These 17 companies deserve individual analysis to determine whether their declines reflect company-specific problems, deteriorating fundamentals, financing requirements, shareholder dilution, or an excessive market reaction.
But we must avoid jumping to conclusions: a company that has fallen sharply is not necessarily an attractive investment opportunity.
Price action must be analyzed alongside fundamentals, technical structure, and relative strength.
4. WHAT DO THESE RESULTS TELL US ABOUT THE BULL MARKET?
This is, in my view, the most important conclusion.
If we were witnessing a widespread destruction of the gains accumulated during this cycle, we would expect to find a much larger proportion of companies trading below their February 2024 levels.
Yet we are seeing precisely the opposite.
More than 91% of the companies analyzed remain in positive territory since the beginning of the bull market.
The correction has been extremely deep, but it has not erased the enormous gains accumulated by most of the companies in the sample.
This is consistent with my technical interpretation: we are going through a very severe correction, but one of a lower degree than the major structural bear markets of the past.
Naturally, these figures do not guarantee that the lows are already in. Nor do they prove, on their own, that every company still has an intact individual uptrend.
But they certainly put the true magnitude of what has happened into perspective.
5. MY CONCLUSION
Long-term bull markets do not advance in a straight line.
They can experience extraordinarily violent corrections that damage sentiment, trigger substantial losses from peak valuations, and lead many investors to question whether the bull market even exists anymore.
And yet, when we broaden our perspective, we discover that a large portion of the gains accumulated throughout the cycle remains intact.
That is precisely the contrast revealed by these 203 securities: a median cumulative return of +209.67% coexisting with a median current drawdown of −38.82%.
That is why I believe it is essential to distinguish between a severe correction and the end of a bull market.
They are two very different things.
I've published my complete quantitative study of 203 gold and silver mining companies, including an interactive ranking showing the individual performance of every security.
Despite the severity of the recent correction, 91.6% of the companies remain in positive territory since February 29, 2024, with a remarkable median cumulative return of +209.67%, even as the median current drawdown stands at −38.82%.
These findings highlight a crucial distinction: a brutal correction does not necessarily mean the end of a bull market.
Explore the full analysis and interactive ranking of all 203 securities at Structural Alpha Research:
structuralalpharesearch.net/…
Methodological note: This study is based on 203 companies with sufficient price history and available data. Returns represent changes in share prices, not total returns adjusted for dividends. The composition of the sample introduces potential selection and survivorship biases; the conclusions describe the companies analyzed and do not necessarily represent the entire sector.
#Gold #Silver #GoldMiners #SilverMiners #GDX #GDXJ #MiningStocks #BullMarket #TechnicalAnalysis
